*2024 P = 2024 Projection
Last Updated: April 25, 2024
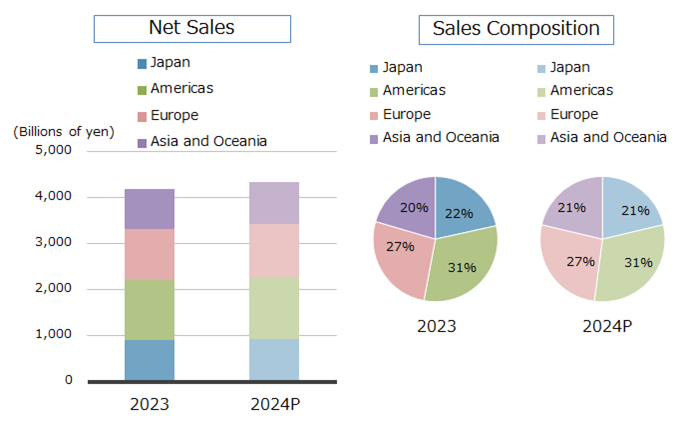
| Net Sales | Sales Composition | |||
|---|---|---|---|---|
| 2023 | 2024P | 2023 | 2024P | |
| Japan | 901.6 | 926.7 | 22% | 21% |
| Americas | 1,312.4 | 1,339.9 | 31% | 31% |
| Europe | 1,111.2 | 1,155.8 | 27% | 27% |
| Asia and Oceania | 855.8 | 927.6 | 20% | 21% |
| Total | 4,181.0 | 4,350.0 | 100% | 100% |