Financial Highlights
*2024 P = 2024 Projection
Last Updated: April 25, 2024
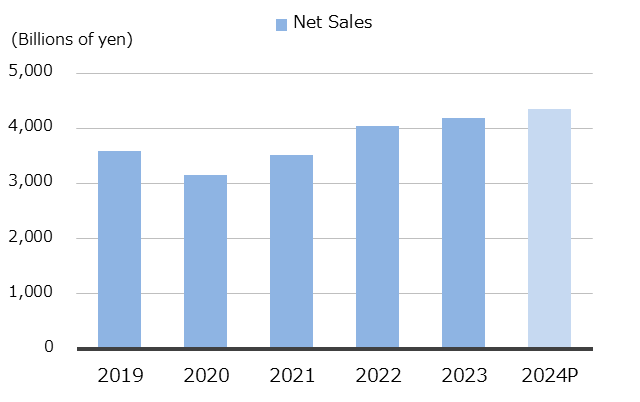
(Billions of yen)
| |
2019 |
2020 |
2021 |
2022 |
2023 |
2024P |
| Net Sales |
3,593.3 |
3,160.2 |
3,513.4 |
4,031.4 |
4,181.0 |
4,350.0 |
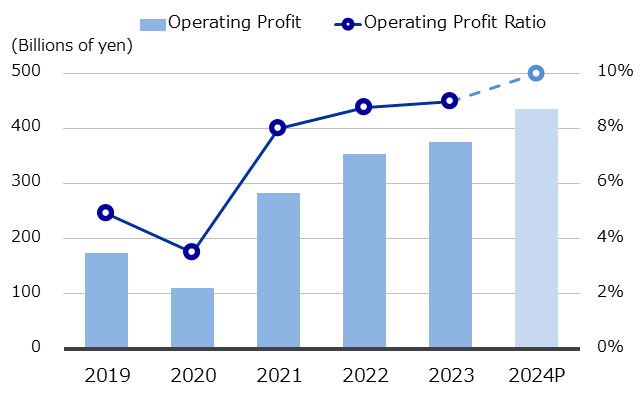
Operating Profit (Consolidated)
(Billions of yen)
| |
2019 |
2020 |
2021 |
2022 |
2023 |
2024P |
| Operating Profit |
174.4 |
110.5 |
281.9 |
353.4 |
375.4 |
435.0 |
| Operating Profit Ratio |
4.9% |
3.5% |
8.0% |
8.8% |
9.0% |
10.0% |
- *Fiscal year figures for 2019 were restated to account for provision for paid leave.
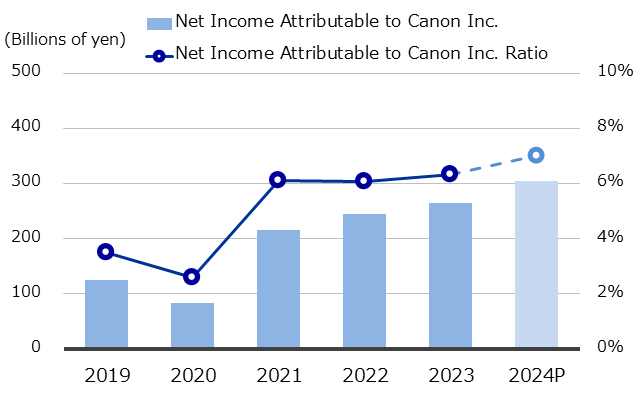
Net Income Attributable to Canon Inc. (Consolidated)
(Billions of yen)
| |
2019 |
2020 |
2021 |
2022 |
2023 |
2024P |
| Net Income Attributable to Canon Inc. |
125.0 |
83.3 |
214.7 |
244.0 |
264.5 |
305.0 |
| Net Income Attributable to Canon Inc. Ratio |
3.5% |
2.6% |
6.1% |
6.1% |
6.3% |
7.0% |
- *Fiscal year figures for 2019 were restated to account for provision for paid leave.
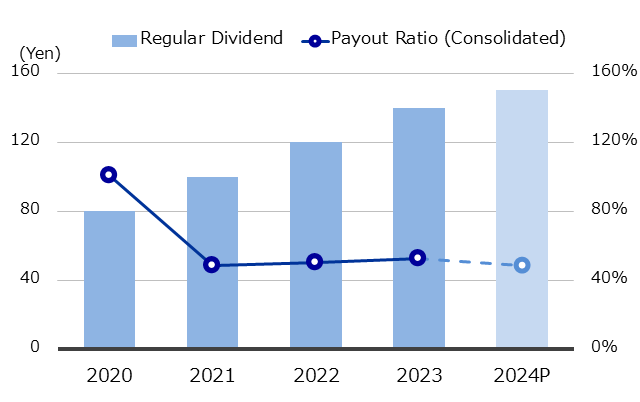
(Yen)
| |
2020 |
2021 |
2022 |
2023 |
2024P |
| Regular Dividend |
80 |
100 |
120 |
140 |
150 |
| Payout Ratio (Consolidated) |
100.4% |
48.7% |
50.3% |
52.6% |
48.6% |
- *Fiscal year figures for 2019 were restated to account for provision for paid leave.