Financial Highlights
- Fiscal Year
- Quarterly
*2026 P = 2026 Projection
Last Updated: July 27, 2026
Net Sales (Consolidated)
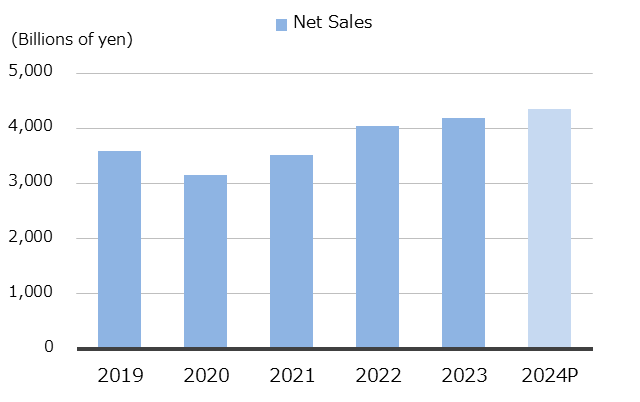
(Billions of yen)
| 2021 | 2022 | 2023 | 2024 | 2025 | 2026P | |
|---|---|---|---|---|---|---|
| Net Sales | 3,513.4 | 4,031.4 | 4,181.0 | 4,509.8 | 4,624.7 | 4,800.0 |
Operating Profit (Consolidated)
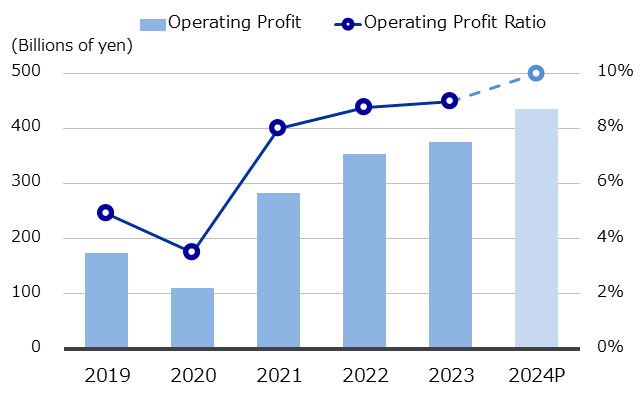
(Billions of yen)
| 2021 | 2022 | 2023 | 2024 | 2025 | 2026P | |
|---|---|---|---|---|---|---|
| Operating Profit | 281.9 | 353.4 | 375.4 | 279.8 | 455.4 | 465.0 |
| Operating Profit Ratio | 8.0% | 8.8% | 9.0% | 6.2% | 9.8% | 9.7% |
Net Income Attributable to Canon Inc. (Consolidated)
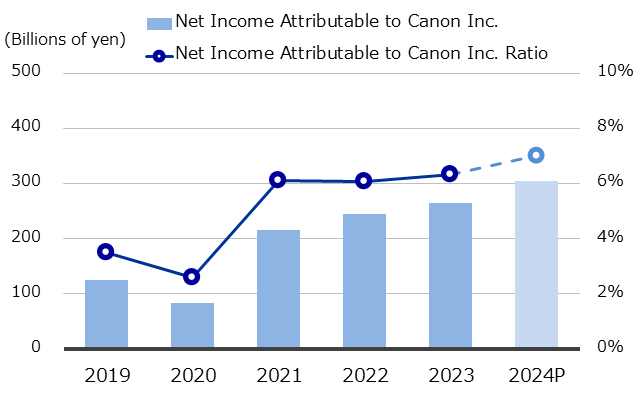
(Billions of yen)
| 2021 | 2022 | 2023 | 2024 | 2025 | 2026P | |
|---|---|---|---|---|---|---|
| Net Income Attributable to Canon Inc. | 214.7 | 244.0 | 264.5 | 160.0 | 332.1 | 340.0 |
| Net Income Attributable to Canon Inc. Ratio | 6.1% | 6.1% | 6.3% | 3.5% | 7.2% | 7.1% |
Dividend
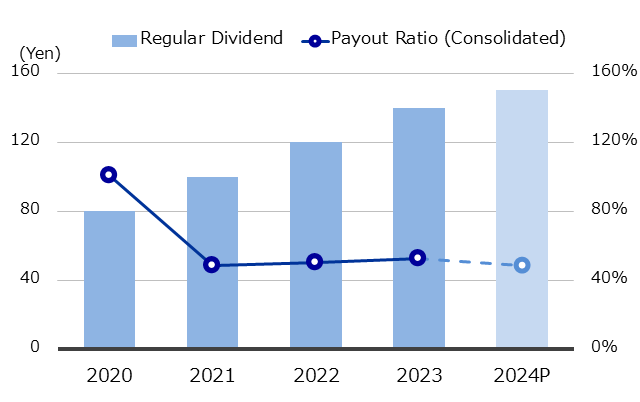
(Yen)
| 2021 | 2022 | 2023 | 2024 | 2025 | 2026P | |
|---|---|---|---|---|---|---|
| Regular Dividend | 100 | 120 | 140 | 155 | 160 | 160 |
| Payout Ratio (Consolidated) | 48.7% | 50.3% | 52.6% | 92.4% | 42.9% | 39.6% |