Environmental Performance Data
As of December 31, 2025 (Data with different aggregation periods are described in the notes.)
Detail figures may not add up to the totals because of rounding.
Last Updated
28 May, 2026
Data on GHG
GHG Emissions in 2025
| Category | Scope | 2025 (1,000 t-CO2e) |
Calculation Method |
|---|---|---|---|
| Scope 1 | Direct GHG emissions | 184 |
|
| Scope 2 | Indirect GHG emissions based on market standards | 817 |
|
| Indirect GHG emissions based on location standards | 779 |
|
|
| Scope 3 | Supply chain-related GHG emissions | 6,773 | |
| Category 1 | Purchased goods and services | 2,590 |
|
| Category 2 | Capital goods | 968 |
|
| Category 3 | Fuel- and energy-related activities not included in Scope 1 or Scope 2 | 173 |
|
| Category 4 | Upstream transportation and distribution | 370 |
|
| Category 5 | Waste generated in operations | 21 |
|
| Category 6 | Business travel | 55 |
|
| Category 7 | Employee commuting | 129 |
|
| Category 8 | Upstream leased assets | 0 |
|
| Category 9 | Downstream transport and distribution | 28 |
|
| Category 10 | Processing of sold products | 0 |
|
| Category 11 | Use of sold products | 2,241 |
|
| Category 12 | End-of-life treatment of sold products | 156 |
|
| Category 13 | Downstream leased assets | 42 |
|
| Category 14 | Franchises | 0 | Not applicable |
| Category 15 | Investments | 0 | Not applicable |
Canon compiles data for greenhouse gas (GHG; energy-derived greenhouse gas CO2, and non-energy derived greenhouse gases PFCs, HFCs, SF6, N2O, methane, and NF3). For CO2 emission factors for electricity, figures provided by individual electric supply companies are used, but publicly disclosed region-specific figures are used when figures are not provided by electric supply companies.
For the use of sold products, the CO2 emission factor for electricity is based on publicly available regional coefficients, and the average value for the sales region is applied. The electricity consumed by products shipped in the target fiscal year—calculated using assumptions such as average years of use and average number of uses (e.g., prints)—is then converted into CO2 emissions.
Third-party Assurance of GHG Emissions (Converted to CO2)
Third-party assurance has been obtained for CO2 emissions data appearing in "2025 Material Balance" and for each figure in "GHG Emissions in 2025."
GHG Emissions at Operational Sites
| 2022 | 2023 | 2024 | 2025 | |
|---|---|---|---|---|
| Japan (1,000 t-CO2e) | 714 | 671 | 684 | 756 |
| Outside Japan (1,000 t-CO2e) | 354 | 286 | 247 | 244 |
| Total (1,000 t-CO2e) | 1,068 | 957 | 931 | 1,001 |
| GHG emissions per unit of consolidated sales (Scope1/2) (t-CO2e/¥100 million) | 27 | 23 | 21 | 22 |
Data on Energy
Energy Consumption by Region in 2025
| Electricity (MWh) |
Gas (km3) |
Oil (kL) |
Other (steam, wide area heating and air conditioning) (TJ) |
|
|---|---|---|---|---|
| Japan | 1,356,075 | 25,068 | 6,304,755 | 256 |
| Americas | 107,669 | 4,618 | 4,369,510 | 0 |
| Europe | 103,076 | 2,977 | 7,425,714 | 88 |
| Asia and Oceania (except Japan) | 371,353 | 1,530 | 939,387 | 65 |
| Total | 1,938,174 | 34,193 | 19,039,365 | 410 |
- ※ Electricity includes the amount generated by renewable energy sources.
- ※ Figures have been third-party assured.
Use of Renewable Energy by Region in 2025
(MWh)
| Electric power | Geothermal power | |
|---|---|---|
| Japan | 43,183 | 0 |
| Americas | 7,165 | 0 |
| Europe | 77,726 | 1,213 |
| Asia and Oceania (except Japan) | 162,511 | 0 |
| Total | 290,584 | 1,213 |
Energy/CO2-saving Effects of Office Equipment (Cumulative)
| Cumulative amount of energy saved (1,000 t-CO2e) |
2013 | 2014 | 2015 | 2016 | 2017 | 2018 | 2019 |
|---|---|---|---|---|---|---|---|
| 0 | 284 | 623 | 930 | 1,267 | 1,667 | 2,119 | |
| 2020 | 2021 | 2022 | 2023 | 2024 | 2025 | ||
| 2,366 | 2,620 | 2,840 | 3,016 | 3,158 | 3,245 |
| Cumulative CO2 emissions reduction effect of sold products (GWh) |
2013 | 2014 | 2015 | 2016 | 2017 | 2018 | 2019 |
|---|---|---|---|---|---|---|---|
| 0 | 571 | 1,280 | 1,939 | 2,670 | 3,553 | 4,560 | |
| 2020 | 2021 | 2022 | 2023 | 2024 | 2025 | ||
| 5,129 | 5,722 | 6,260 | 6,690 | 7,040 | 7,262 |
- ※ Covered products: Electrophotographic multifunction devices and laser printers for offices (excluding production printers).
- ※ Energy-saving effect using the average energy (electricity) consumed by products sold five years prior to each respective year, assuming that products sold each year are in use for five years.
- ※ CO2 emissions factors are calculated by using the weighted average of sales per region based on emission factors published by the Federation of Electric Power Companies (in Japan) and the International Energy Agency (outside Japan).
Data on Waste
Recovery Volume by Type of Waste in 2025
(t)
| Type of Waste | Type of Recovery Treatment | Recovery Amount |
|---|---|---|
| Paper | Cardboard, paper used by office equipment, toilet paper, raw material for paper products, building board, roadbed materials, etc. | 16,028 |
| Plastics | Raw materials for plastic products and other applications, roadbed materials, cement materials, fuels, blast furnace reducing agents, soil improvement agents, etc. | 15,857 |
| Metals | Raw materials for metals, roadbed materials, etc. | 19,450 |
| Oils, acids and alkalis | Cement materials, fuels, roadbed materials, reuse of oils, chemicals and solvents, etc. | 12,435 |
| Sludge | Cement materials, construction materials, aggregates, metal materials, organic fertilizers, compost, etc. | 4,416 |
| Wood | Construction boards, bedding for plants, pulp materials, fuels, fertilizers, etc. | 5,698 |
| Glass and ceramics | Glass materials, roadbed materials, cement, metal materials, etc. | 241 |
| Others | Combustion aid, roadbed materials, soil improvement agents, iron-making materials, metal materials, etc. | 10,255 |
| Total | 84,382 |
- * It shows the amount of recycled waste out of the total amount of waste generated.
Hazardous Waste (waste oil, waste acid, waste alkali)
(t)
| 2021 | 2022 | 2023 | 2024 | 2025 | |
|---|---|---|---|---|---|
| Hazardous Waste (waste oil, waste acid, waste alkali) | 12,075 | 10,943 | 11,372 | 12,196 | 12,435 |
- * 100% recovered
Landfill Amount of General Waste Generated by Business Activities
(t)
| 2021 | 2022 | 2023 | 2024 | 2025 | |
|---|---|---|---|---|---|
| General landfill waste generated by business activities | 2,710 | 2,365 | 1,926 | 1,713 | 1,371 |
Atmospheric Emissions
SOx and NOx Emissions
(t)
| 2021 | 2022 | 2023 | 2024 | 2025 | |
|---|---|---|---|---|---|
| SOx | 0.7 | 0.6 | 0.7 | 0.4 | 0.4 |
| NOx | 44.3 | 41.4 | 41.1 | 41.7 | 40.9 |
Data on Water Resources
Total Wastewater Discharge
(1,000m3)
| 2021 | 2022 | 2023 | 2024 | 2025 | |
|---|---|---|---|---|---|
| Japan | 4,204 | 4,053 | 4,443 | 4,539 | 4,486 |
| Outside Japan | 2,669 | 2,444 | 2,400 | 2,369 | 2,158 |
| Total | 6,873 | 6,497 | 6,843 | 6,907 | 6,643 |
Total Water Discharge Data by Destination
(1,000m3)
| 2021 | 2022 | 2023 | 2024 | 2025 | |
|---|---|---|---|---|---|
| Ocean total discharge | 0 | 0 | 0 | 0 | 0 |
| Surface Water total discharge | 1,306 | 1,163 | 1,185 | 1,231 | 1,192 |
| Subsurface / well total discharge | 0 | 0 | 0 | 0 | 0 |
| Off-site water treatment total discharge | 5,567 | 5,334 | 5,659 | 5,676 | 5,451 |
| Beneficial / other use total discharge | 0 | 0 | 0 | 0 | 0 |
| Total | 6,873 | 6,497 | 6,843 | 6,907 | 6,643 |
Wastewater Amount by Discharge Route in 2025
(1,000m3)
| Rivers | Sewerage System | Total | |
|---|---|---|---|
| Japan | 803 | 3,683 | 4,486 |
| Outside Japan | 389 | 1,768 | 2,158 |
| Total | 1,192 | 5,451 | 6,643 |
2025 Water Quality Data
(t)
| 2025 | |
|---|---|
| SS | 152 |
| BOD | 143 |
Water Consumption in 2025 by Type
(1,000m3)
| Public Water |
Industrial Water |
Ground water |
Total | |
|---|---|---|---|---|
| Japan | 1,808 | 2,533 | 1,352 | 5,693 |
| Outside Japan | 1,471 | 993 | 247 | 2,712 |
| Total | 3,279 | 3,527 | 1,600 | 8,405 |
- ※ Figures have been third-party assured.
Use of Recycled Water and Recycling Rate in 2025
| Recycled Water (1,000m3) | Recycling Rate (%) | |
|---|---|---|
| Japan | 1,295 | 22.8 |
| Outside Japan | 33 | 1.2 |
| Total | 1,329 | 15.8 |
Total Water Withdrawal Data by Source
(1,000m3)
| 2021 | 2022 | 2023 | 2024 | 2025 | |
|---|---|---|---|---|---|
| Surface water from rivers, lakes, natural ponds | 0 | 0 | 0 | 0 | 0 |
| Groundwater from wells, boreholes | 1,448 | 1,465 | 1,627 | 1,556 | 1,600 |
| Used quarry water collected in the quarry | 0 | 0 | 0 | 0 | 0 |
| Municipal potable water | 7,130 | 6,932 | 7,036 | 7,137 | 6,806 |
| External wastewate | 0 | 0 | 0 | 0 | 0 |
| Harvested rainwater | 0 | 0 | 0 | 0 | 0 |
| Sea water, water extracted from the sea or the ocean | 0 | 0 | 0 | 0 | 0 |
| Total | 8,578 | 8,397 | 8,663 | 8,693 | 8,405 |
Data on Chemical Substances
Amount of Chemical Substances in 2025
(t)
| 2025 | |
|---|---|
| Japan | 9,663 |
| Outside Japan | 564 |
| Outside Japan | 10,227 |
VOC Emissions in 2025
(t)
| 2025 | |
|---|---|
| Japan | 118 |
| Outside Japan | 218 |
| Outside Japan | 336 |
2025 List of Chemical Substances Subjected to the PRTR Act
(kg)
| Statutory No. |
Name of Substance | Emissions Volume | Transfer Volume | |||
|---|---|---|---|---|---|---|
| Atmosphere | Public Water | Sewerage System |
Waste | Waste Recyclables |
||
| 7 | N-butyl acrylate | 1 | 0 | 0 | 0 | 15,034 |
| 20 | 2-aminoethanol | 972 | 0 | 79 | 74 | 26,316 |
| 31 | Antimony and its compounds | 12 | 0 | 0 | 0 | 125 |
| 53 | Ethylbenzene | 814 | 0 | 0 | 2,108 | 20,037 |
| 71 | Ferric chloride | 0 | 0 | 0 | 4,835 | 0 |
| 80 | Xylene | 3,781 | 0 | 1 | 3,837 | 100,843 |
| 125 | Monochlorobenzene | 28 | 0 | 0 | 9 | 1,504 |
| 128 | Methyl chloride | 4 | 0 | 0 | 0 | 0 |
| 150 | 1,4-dioxane | 291 | 0 | 0 | 0 | 436 |
| 202 | Diphenylamine | 0 | 0 | 0 | 0 | 0 |
| 232 | N,N-dimethylformamide | 194 | 0 | 0 | 0 | 328 |
| 240 | Styrene | 132 | 0 | 0 | 40 | 48,319 |
| 259 | Tetraethylthiuram disulfide | 0 | 0 | 0 | 0 | 0 |
| 296 | 1,2,4-trimethylbenzene | 264 | 0 | 0 | 0 | 336 |
| 298 | Tolylene diisocyanate | 0 | 0 | 0 | 0 | 194 |
| 299 | Toluidin | 1 | 0 | 0 | 0 | 0 |
| 300 | Toluene | 7,350 | 0 | 202 | 637 | 31,004 |
| 306 | Hexamethylene diacrylate | 3 | 0 | 0 | 0 | 0 |
| 308 | Nickel | 0 | 0 | 0 | 134 | 430 |
| 309 | Nickel compounds | 0 | 0 | 0 | 13 | 1,375 |
| 343 | Pyrocatechol | 22 | 0 | 0 | 0 | 2,772 |
| 349 | Phenol | 11 | 0 | 0 | 0 | 25 |
| 374 | Hydrogen fluoride and its water-soluble salts | 5 | 272 | 3,747 | 46 | 15,334 |
| 395 | Water-soluble salts of peroxodisulfuric acid | 0 | 0 | 25 | 0 | 4,003 |
| 408 | Poly (oxyethylene) octylphenyl ether | 0 | 0 | 0 | 159 | 67 |
| 412 | Manganese and its compounds | 0 | 0 | 0 | 19 | 298 |
| 438 | Methylnaphthalene | 10 | 0 | 0 | 0 | 56 |
| 448 | Methylenebis (4,1-phenylene) diisocyanate | 0 | 0 | 0 | 0 | 323 |
2025 Material Balance
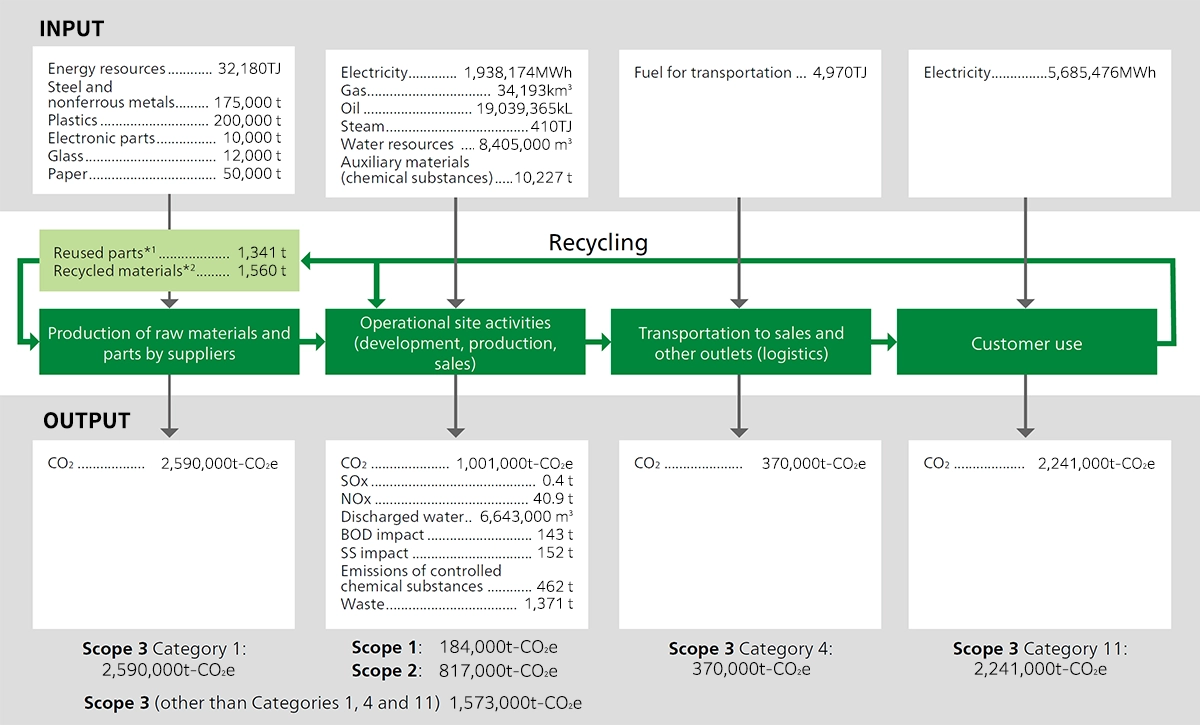
- ※1 Reused products parts
- ※2 Plastic from used products for use as raw materials in new products
List of ISO14001 Certified Sites and Subsidiaries (Canon Group Consolidated)
| Name | Location |
|---|---|
| Canon Inc. (1 company, 15 operational sites) | |
| Headquarters (Shimomaruko) | Tokyo |
| Yako Office | Kanagawa |
| Kawasaki Office | Kanagawa |
| Tamagawa Office | Kanagawa |
| Kosugi Office | Kanagawa |
| Hiratsuka Plant | Kanagawa |
| Ayase Plant | Kanagawa |
| Fuji-Susono Research Park | Shizuoka |
| Utsunomiya Plant | Tochigi |
| Toride Plant | Ibaraki |
| Ami Plant | Ibaraki |
| Utsunomiya Optical Products Plant | Tochigi |
| Optics R&D Center | Tochigi |
| Oita Plant | Oita |
| Canon Inc. Bando Logistics Center | Ibaraki |
| Marketing Headquarters in Japan (1 company) | |
| Canon Marketing Japan Inc. | Tokyo |
| Manufacturing Subsidiaries in Japan (22 companies) | |
| Canon Electronics Inc. | Saitama |
| Canon Finetech Nisca Inc. | Saitama |
| Fukui Canon Materials Inc. | Fukui |
| Canon Precision Inc. | Aomori |
| Canon Chemicals Inc. | Ibaraki |
| Oita Canon Inc. | Oita |
| Miyazaki Canon Inc. | Miyazaki |
| Canon Optron, Inc. | Ibaraki |
| Canon Components, Inc. | Saitama |
| Nagahama Canon Inc. | Shiga |
| Oita Canon Materials Inc. | Oita |
| Canon Semiconductor Equipment Inc. | Ibaraki |
| Canon Ecology Industry Inc. | Ibaraki |
| Ueno Canon Materials Inc. | Mie |
| Fukushima Canon Inc. | Fukushima |
| Canon Mold Co., Ltd. | Ibaraki |
| Canon ANELVA Corporation | Kanagawa |
| Canon Machinery Inc. | Shiga |
| Canon Tokki Corporation | Niigata |
| Nagasaki Canon Inc. | Nagasaki |
| Canon Medical Systems Corporation | Tochigi |
| Canon Electron Tubes & Devices Co., Ltd. | Tochigi |
| Manufacturing Subsidiaries Outside Japan (21 companies) | |
| Canon Virginia, Inc. | U.S.A. |
| Canon Environmental Technologies, Inc. | U.S.A. |
| Canon Giessen GmbH | Germany |
| Canon Bretagne S.A.S. | France |
| Canon Inc., Taiwan | Taiwan |
| Canon Opto (Malaysia) Sdn. Bhd. | Malaysia |
| Canon Electronics (Malaysia) Sdn. Bhd. | Malaysia |
| Canon Hi-Tech (Thailand) Ltd. | Thailand |
| Canon Dalian Business Machines, Inc. | PRC |
| Canon Medical Equipment (Dalian) Co., Ltd. | PRC |
| Canon Vietnam Co., Ltd. | Vietnam |
| Canon Zhongshan Business Machines Co., Ltd. | PRC |
| Canon (Suzhou) Inc. | PRC |
| Canon Finetech Nisca (Shenzhen) Inc. | PRC |
| Canon Machinery (Malaysia) Sdn. Bhd. | Malaysia |
| Canon Prachinburi (Thailand) Ltd. | Thailand |
| Canon Business Machines (Philippines), Inc. | Philippines |
| Canon Production Printing Netherlands B.V. | The Netherlands |
| Canon Production Printing Germany G.m.b.H. & Co. KG | Germany |
| Canon Electronics Vietnam Co., Ltd. | Vietnam |
| Canon Electronic Business Machines (H.K.) Co., Ltd. | Hongkong |
| Marketing Headquarters Outside Japan (6 companies) | |
| Canon U.S.A., Inc. | U.S.A. |
| Canon Europe Ltd. | United Kingdom |
| Canon Europa N.V. | The Netherlands |
| Canon (China) Co., Ltd. | PRC |
| Canon Singapore Pte. Ltd. | Singapore |
| Canon Australia Pty. Ltd. | Australia |
| Other companies with ISO 14001 certification (62 companies) | |
| In Japan (14) | |
| Outside Japan (48) | |
- * Environmental data (except CO2 emissions) refer to 113 ISO14001-certified companies and one non-certified company (Axis Communications AB).
However, environmental accounting excludes some sites whose impact on the total is small.