Climate Change
Basic Approach / Targets and Achievements
Canon is working to reduce GHG emissions at all stages of the product life cycle.
Canon seeks to consistently meet its environmental targets and, beyond that, is working toward net-zero CO2 emissions from its business activities by 2050. To that end, we quantify emissions during the whole product life cycle—from the upstream supply of raw materials and parts through operational site activities and logistics to customer use—and use technology to reduce emissions at each stage.
For 2050
We aim to achieve net-zero GHG emissions for entire product life cycle (Scope 1-3) by 2050.
2030 Targets
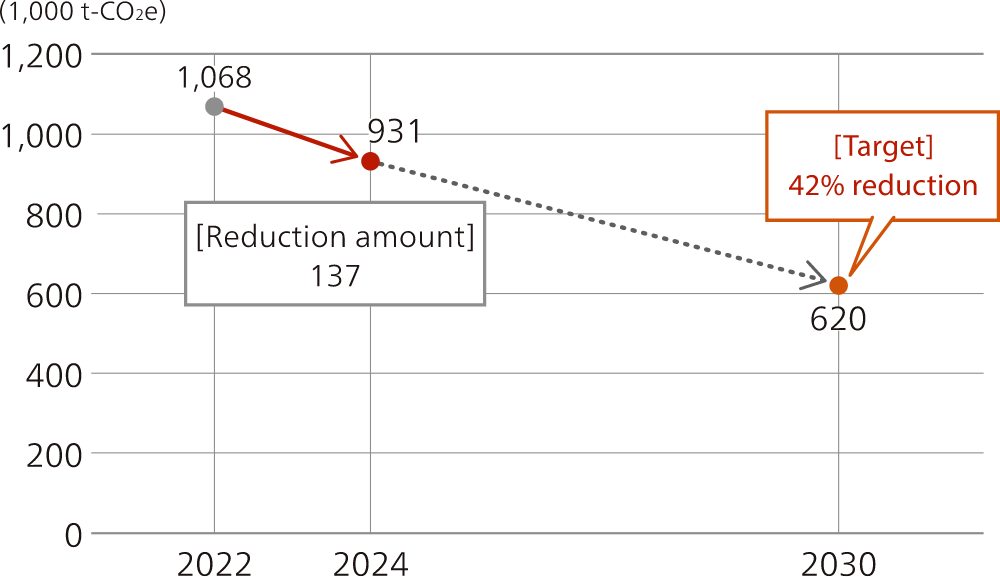
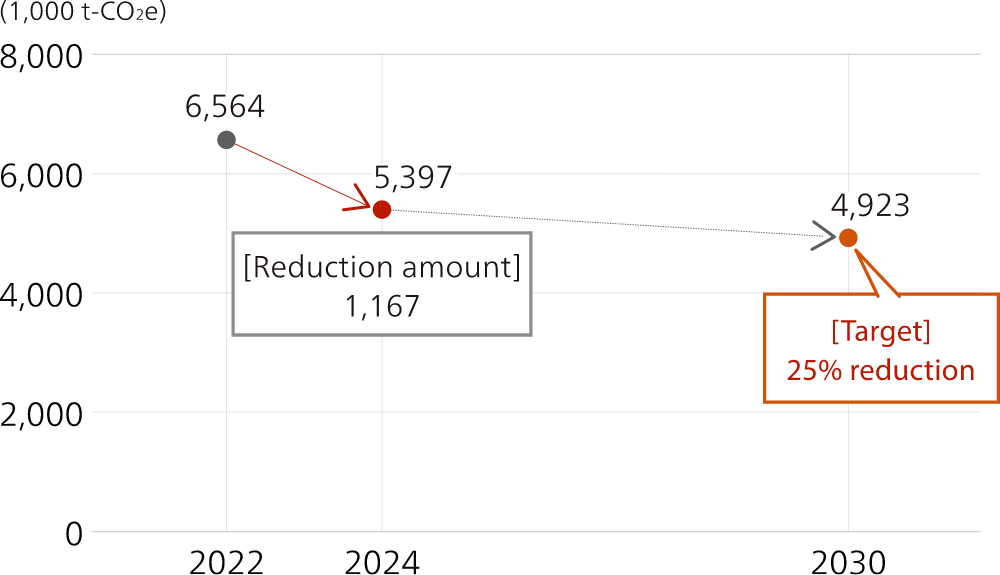
- Reduce Scope 1 & 2 GHG emissions by 42% compared to 2022, reduce Scope 3 (category 1 and 11) GHG emissions by 25% compared to 2022.
- Work toward a 3% average annual improvement in the index of life cycle CO2 emissions (per product unit), realizing a cumulative improvement of 50% compared to 2008 by continually achieving this target.
GHG Emissions Reduction (Diagram)
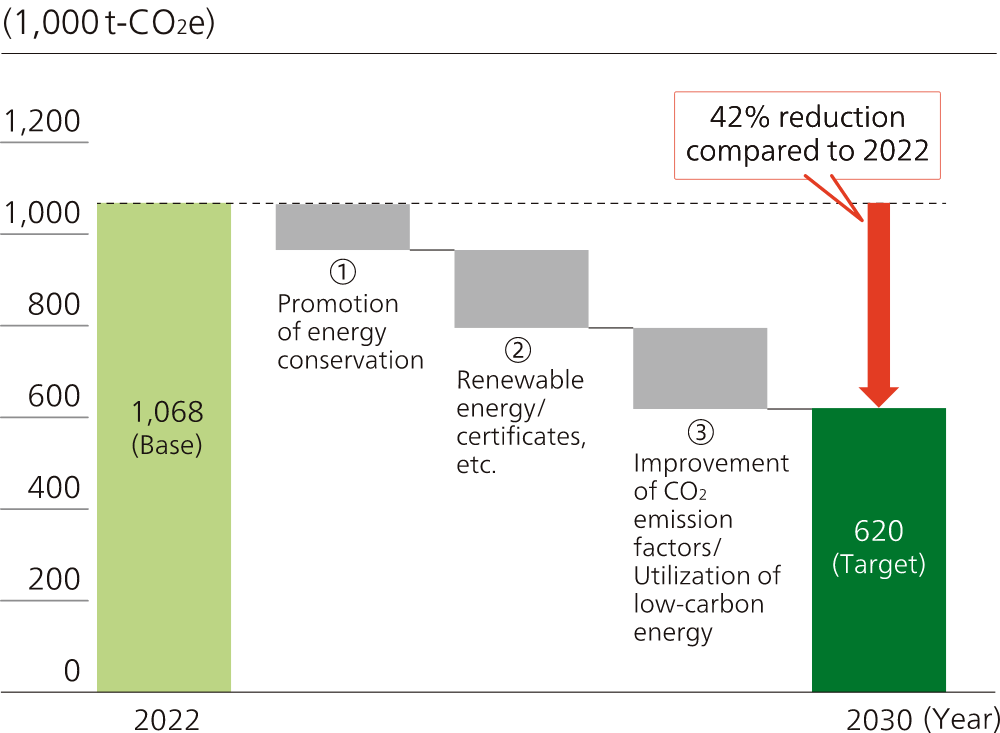
Scope 1&2
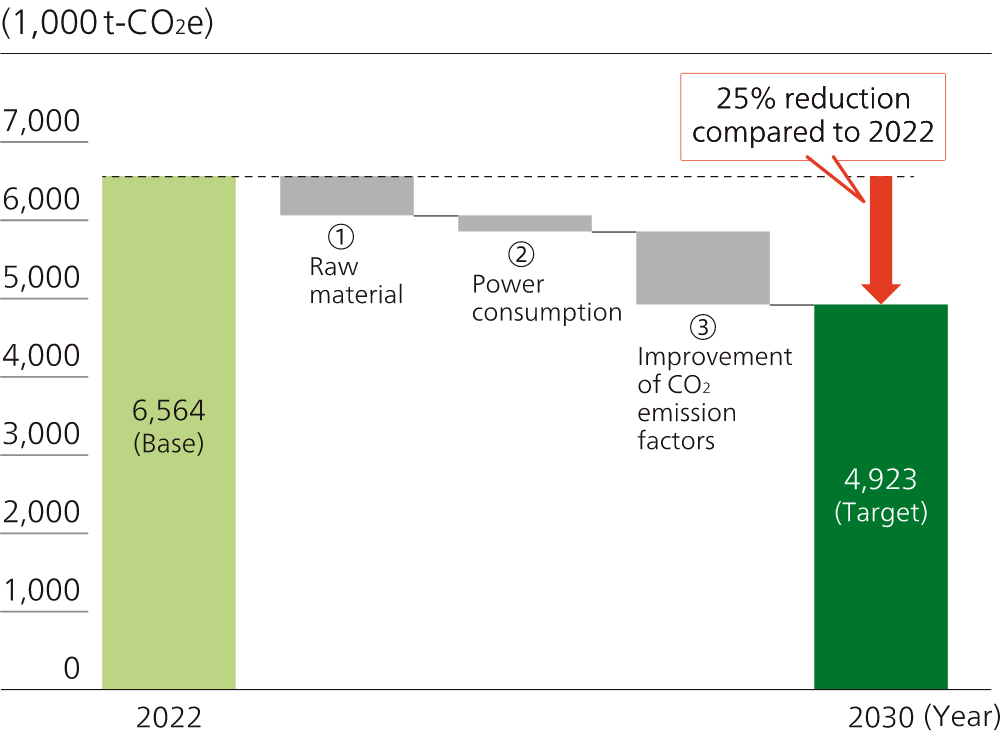
Scope 3 (Categories 1, 11)
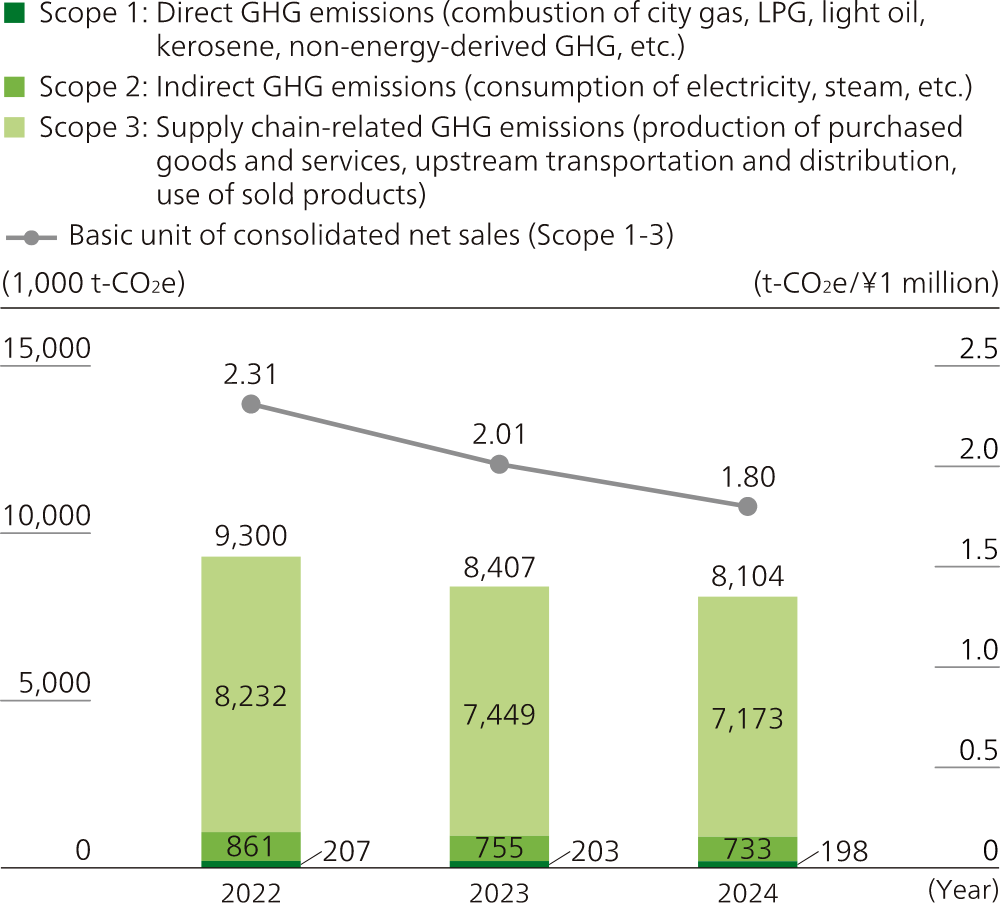
- Scope 1: Direct emissions (city gas, LPG, diesel oil, kerosene, non-energy greenhouse gases, etc.)
- Scope 2: Indirect emissions (electricity, steam, etc.)
- Scope 3: Emissions in the supply chain (category 1: Purchased goods and services, category 11: Use of products sold)
Canon's GHG Emissions-reduction Initiatives (2030 Targets)
Canon is working to reduce greenhouse gas emissions by assessing the impact of climate change on the entire product life cycle, from the manufacturing of materials and parts at suppliers, transportation to retailers, use by customers, and disposal and recycling.
Canon aims to achieve net zero GHG emissions by 2050, and to reduce its scope 1 and 2 GHG emissions by 42% compared to 2022 and scope 3 (category 1 and 11) GHG emissions by 25% compared to 2022 by 2030. These targets for 2030 have been verified by SBTi*, an international initiative that recommends setting scientifically based GHG emissions reduction targets.
To reach these targets, we are promoting various initiatives, including the development of products using recycled materials, product downsizing and weight reduction, energy-saving activities at production sites, energy saving during product use, product recycling, and efficient logistics.
- * Some of the data for 2022 has been recalculated in line with the 2025 calculation method.
Acceptance of TCFD Recommendations
Canon accepts the recommendations of the final report of the Task Force on Climate-related Financial Disclosures (TCFD).
Framework for Managing Climate Impact (Governance)
The impact of climate change on Canon, response plans and targets were discussed at the Climate Change Working Group (WG) under the Sustainability Committee. The Climate Change Working Group is comprised of senior managers from each business and corporate division. The content of discussions is reported to the Sustainability Committee, and after approval, it is reported to the CEO.
To achieve these targets, the Sustainability Headquarters plays a central role in promoting activities throughout Canon. The progress of targets is reported to the management every month, and the annual review is reported to the CEO.
Global Environmental Promotion System
Scenario Analysis to Identify Risks and Opportunities, Financial Impact (Strategy)
Canon conducts scenario analysis based on the TCFD framework, which is recommended in non-financial disclosure, to identify climate-related risks and opportunities and analyze their financial impact. For details, please refer to the annual securities report of Canon Inc.
| Annual Securities Report |
Climate-related Indicators and Targets
Canon aims to reduce its GHG emission throughout the product life cycle to net zero by 2050. To achieve this goal, we have set an overall target to reduce Scope 1 and 2 GHG emissions by 42% in 2030 compared to 2022, and reduce Scope 3 (categories 1 and 11) GHG emissions by 25% compared to 2022. In November 2023, these targets were validated by SBTi.
Since 2008, we have set a target of "an average improvement in life cycle CO2 emissions per unit of product of 3% per year" (basic unit target) as a comprehensive target of Canon's environmental targets. By consistently achieving this target, we expect to achieve a 50% improvement in 2030 compared to 2008. In 2025, the annual average was 3.59%, exceeding the target, and an improvement of 45.5% compared to 2008.
During the fiscal year ended March 31, 2018, the actual life cycle CO2 emissions (the total of Scopes 1, 2 and 3) were 7,774,000 t-CO2e, with Scope 1 emissions of 184,000 t-CO2e, Scope 2 emissions of 817,000 t-CO2e and Scope 3 emissions of 6.773 million t-CO2e. We will continue to achieve these targets in the next fiscal year and beyond.
In 2025, in terms of SBTi, through the promotion of various energy-saving measures, the introduction of renewable energy, the adoption of smaller, lighter, and low-carbon emission components, we achieved a reduction of 6.3% in Scope 1 and 2, and 19.4% in Scope 3 (categories 1 and 11) compared to 2022.
Environmental Targets and Achievements
In Canon, environmental targets are set in line with our three-year management plan and reviewed every year to determine whether changes are necessary. Under the overall target of a 3% average annual improvement in the index of life cycle CO2 emissions per product unit, our product target is a 3% average annual improvement in the index of CO2 emissions per product unit associated with raw materials and product utilization. The operational site target includes target figures for reductions per basic unit in energy consumption.
As for the operational site target, we also set goals for waste emissions, water consumption, and controlled chemical substance emissions, thus making the management of environmental risks and opportunities more comprehensive and conclusive.
Monitoring of Progress toward Environmental Targets
| 2030 Targets | 2025 Achievements* | |
|---|---|---|
| GHG emissions (compared to 2022) |
42% reduction for Scope 1 & 2 25% reduction for Scope 3 (category 1 and 11) |
Scope 1 & 2: 6.3% reduction Scope 3: 19.4% reduction |
Environmental Performance Data
GHG Emissions
Scope 1 & 2
Scope 3 (category 1, 11)*
- * Some of the data for 2022 and 2030 has been recalculated in line with the 2025 calculation method.
Progress Relative to Overall Target
In 2025, we made progress with ongoing improvement in product life cycle emissions via upgraded site-based energy-efficiency measures; development of better energy-efficient products; reduced use of air freight; and other measures. As a result, against the target of a 3% average annual improvement in the index of life cycle CO2 emissions per product unit, we realized an average annual improvement of 3.59% between 2008 to 2025 and cumulative improvement of 45.5% from 2008.
Achievement of Product Targets
We continued with initiatives, including efforts to make products more compact, lightweight, and energy efficient, and achieved an average annual improvement of 2.13% (2008–2025) in raw materials and use CO2 emissions per product, falling short of our target of 3%.
Achievement of Operational Site Targets
Improvement in Energy Consumption Per Basic Unit at Operational Sites
Due to more efficient production and other factors, overall energy consumption per basic unit improved by 5.4% in 2025, exceeding the 2.4% improvement target. We aim to meet this target again in 2026 by reducing energy consumption and further improving production efficiency.
Improvement in Total Waste Generation
Owing to ongoing improvement measures at each site, such as reducing packaging materials by using returnable boxes and reducing the use of evaluation sheets, total waste generation per basic unit improved by 1.6% in 2025, exceeding the 1% improvement target. In 2026, we will aim to continuously achieve our targets by advancing collaborative activities with partners, such as reducing packaging for procured materials.
Improvement in Water Usage Per Basic Unit in Production
Due to factors including equipment maintenance and greater cooling water usage due to high temperatures, water usage per basic unit improved by 0.9%, missing the 1% improvement target. In 2026, we will move ahead with actions to meet the improvement target, including raising the efficiency of the cleaning process for manufacturing equipment.
Improvement in Emissions of Controlled Chemical Substances Per Basic Unit
Due to factors including an increase in parts cleaning, emissions of controlled chemical substances per basic unit improved by 0.9%, but fell short of the 1% improvement target. In 2026, we will move ahead with actions to meet the improvement target, including review of chemical substance use conditions and operating conditions of detoxification equipment.
2026 Targets
We are revising the 2026 waste and chemical substance targets as follows, taking into account societal demands and other factors.
- Waste: Maintain the downward trend* in total waste generation
- Controlled chemical substances: Maintain the downward trend* in emissions All other targets will remain unchanged from 2025.
- * The trend is based on a linear approximation of the three-year average values from the base year (2020).
| 2030 Targets | 2025 Achievements*2 | |
|---|---|---|
| Improvement in per-unit Life cycle CO2 emissions index (compared to 2008) | 50% improvement | 45.5% improvement |
| 2025 Targets | 2025 Achievements*2 | |
|---|---|---|
| Overall (Life cycle) | 3%-per-year average improvement in Life cycle CO2 emissions improvement index per product | Average annual 3.59% improvement (2008–2025) |
| Products | 3%-per-year average improvement in raw materials and use CO2 emissions improvement index per product | Average annual 2.13% improvement (2008–2025) |
| 2025 Targets*1 | 2025 Achievements*2 | |
|---|---|---|
| Operational Sites | Energy consumption per basic unit: 2.4% improvement | 5.4% improvement |
- *1 Calculation based on average annual improvement rate of the three most recent years. For energy consumption at Japanese operational sites, however, calculation as stipulated in Act on Rationalizing Energy Use. The basic unit denominator is decided according to the characteristics of each operational site (production volume, effective floor area, workforce, etc.)
- *2 For scope of data collection:Environmental Performance Data
Index of Life Cycle CO2 Emissions Per Product Unit
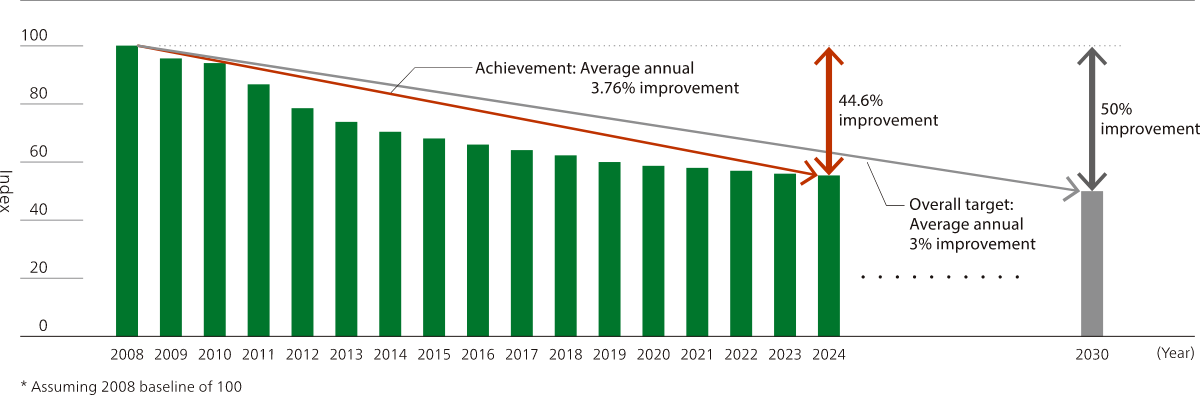
- * Assuming 2008 baseline of 100
Overview of Environmental Impacts
GHG emissions for entire product life cycle (Scope 1-3) in 2025 were approximately 7.77 million t-CO2e. Chiefly as a result of actions to conserve energy, and the switch to electricity with lower CO2 emissions, we achieved a reduction of approximately 50,000 t-CO2e over the entire product life cycle. The resources (input) that Canon used in its business activities and emissions (output) to the global environment over the entire product life cycle are as shown in the 2025 Material Balance section of the Data Summary.
Life Cycle CO2 Emissions
- * Data for 2025 has been third-party assured. In addition, some of the data from 2022 onward has been recalculated in line with the 2025 calculation method.