Environmentally Conscious Management
Targets and Achievements
Environmental Targets and Achievements
For 2050
We aim to achieve net-zero CO2 emissions for the whole product lifecycle (Scope 1-3)* by 2050.
- * Scope 1: Direct GHG emissions (combustion of city gas, LPG, light oil, kerosene, non-energy derived GHG, etc.)
- Scope 2: Indirect GHG emissions (consumption of electricity, steam, etc.)
- Scope 3: Supply chain-related GHG emissions (production of purchased goods and services [Category 1], upstream transportation and distribution [Category 4], use of sold products [Category 11])
2030 Targets
- Reduce Scope 1 & 2 emissions by 42% compared to 2022, reduce Scope 3 (category 1 and 11) emissions by 25% compared to 2022 (The Science Based Targets initiative* approves Canon's GHG emission reduction targets).
- Work toward a 3% average annual improvement in the index of lifecycle CO2 emissions (per product unit), realizing a cumulative improvement of 50% compared to 2008 by continually achieving this target.
- * Science Based Targets initiative (SBTi): The Science Based Targets initiative is a global body enabling businesses and financial institutions to set ambitious emissions reductions targets in line with climate science.
Environmental Targets and Achievements
| 2030 Targets | 2023 Achievements*2 | |
|---|---|---|
| Total CO2 emissions (compared to 2022) | 42% reduction for Scope 1 & 2, 25% reduction for Scope 3 (category 1 and 11) | Scope 1 & 2: 10.2% reduction; Scope 3: 18.5% reduction |
| Improvement in per-unit lifecycle CO2 emissions index (compared to 2008) | 50% improvement | 44.4% improvement |
| 2023–2025 Targets | 2023 Achievements*2 | |
| Overall (Lifecycle) | 3%-per-year average improvement in lifecycle CO2 emissions improvement index per product | Avg. improvement: 3.95 p.a. (2008–2023) |
| Products | 3%-per-year average improvement in raw materials and use CO2 emissions improvement index per product | Avg. improvement: 2.37 p.a. (2008–2023) |
| 2023 Targets*1 | 2023 Achievements*2 | |
| Operational Sites | Energy consumption per basic unit : 2.4% | 4.5 % improvement |
| Total waste generation per basic unit: 1% | 1.4% deterioration | |
| Water usage per basic unit: 1% | 0.8% deterioration | |
| Emissions of controlled chemical substances per basic unit: 1% | 0.2% deterioration |
- *1 Calculation based on average annual improvement rate of the three most recent years. For energy consumption at Japanese operational sites, however, calculation as stipulated in Act on Rationalizing Energy Use. The basic unit denominator is decided according to the characteristics of each operational site (production volume, effective floor area, workforce, etc.)
- *2 For scope of data collection: https://global.canon/en/sustainability/report/pdf/data-2024-e.pdf
| Environmental Data |
We have set environmental targets in line with SBT* (Scope 1 & 2 and Scope 3 emissions) and with our three-year management plan. We review the targets yearly to determine whether changes are necessary. Canon has set an overall target of a 3% average annual improvement in the index of lifecycle CO2 emissions per product unit, covering CO2 emissions generated at all stages of the product life cycle, as part of the Canon Group Environmental Targets. Under this overall target, our product target is a 3% average annual improvement in the index of CO2 emissions per product unit associated with raw materials and product utilization. The operational site target includes target figures for reductions per basic unit in energy consumption, total waste emissions, water consumption and controlled chemical substance emissions.
- * SBT (Science Based Targets): Greenhouse gas emission reduction targets set by companies in line with standards required by the Paris Agreement.
SBT Progress (Total CO2 Emissions)


Index of Lifecycle CO2 Emissions Per Product Unit
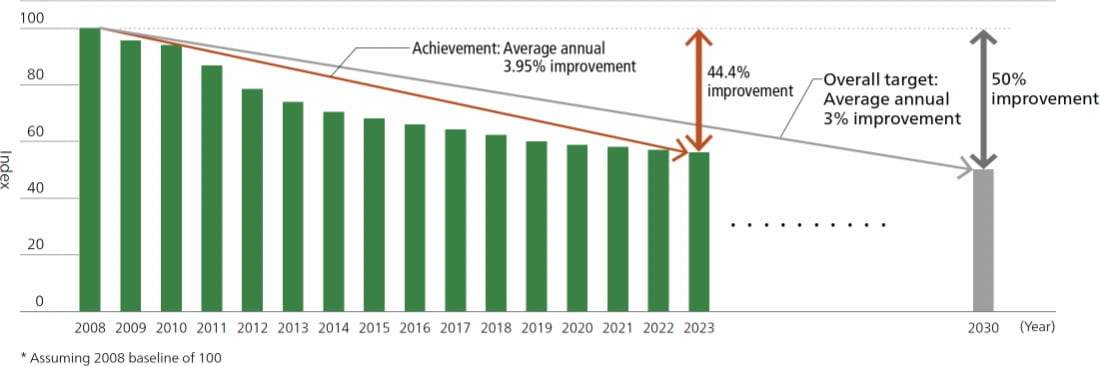
Progress Relative to Overall Target
In 2023, we made progress with ongoing improvement in product lifecycle emissions via upgraded site-based energy-efficiency measures; greater adoption of renewable energy sources; development of better energy-efficient products; reduced use of air freight; and other measures. As a result, against the target of a 3% average annual improvement in the index of lifecycle CO2 emissions per product unit,we realized an average annual improvement of 3.95% between 2008 to 2023 and total improvement of 44.4% from 2008.
Achievement of Product Targets
We continued with initiatives, including efforts to make products more compact, lightweight, and energy efficient, and achieved an average annual improvement of 2.37% (2008–2023) in raw materials and use CO2 emissions per product, falling just short of our target of 3%.
Achievement of Operational Site Targets
- Energy Consumption Per Basic Unit at Operational Sites
Due to more efficient production and other factors, overall energy consumption per basic unit improved by 4.5% in 2023, exceeding the 2.4% improvement target. We aim to meet this target again in 2024 by reducing energy consumption and further improving production efficiency.
- Total Waste Generation Per Basic Unit
Due to factors including an increase in the amount of waste generated during production adjustments, waste emissions per basic unit in 2023 fell by 1.4%, missing the 1% improvement target. In 2024, we will move ahead with actions to meet the improvement target, including optimizing cleaning conditions.
- Water Usage Per Basic Unit in Production
Due to factors including equipment maintenance and greater cooling water usage due to high temperatures, water usage per basic unit deteriorated by 0.8%, missing the 1% improvement target. In 2024, we will move ahead with actions to meet the improvement target, including raising the efficiency of the cleaning process for manufacturing equipment.
- Emissions of Controlled Chemical Substances Per Basic Unit
Due to factors including an increase in parts cleaning, emissions of controlled chemical substances per basic unit fell by 0.2%, missing the 1% improvement target. In 2024, we will move ahead with actions to meet the improvement target, including raising the efficiency of the cleaning process.
2024 Targets
Unchanged from 2023.
Overview of Environmental Impacts
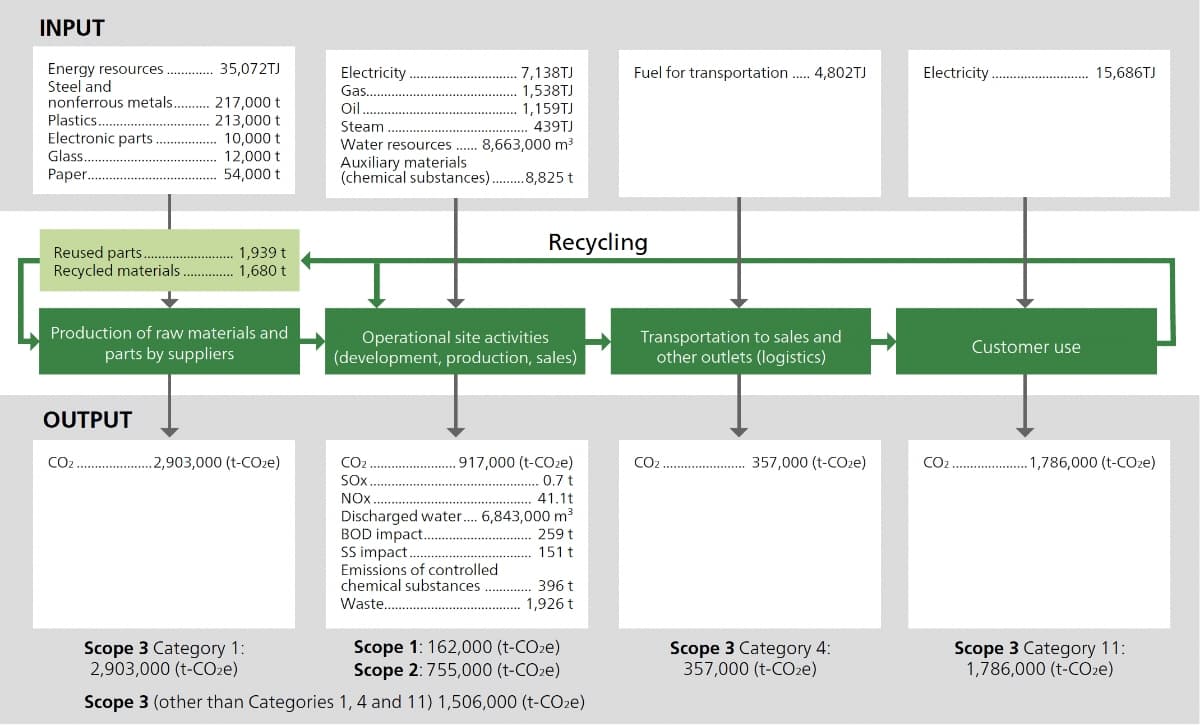
Total product lifecycle CO2 emissions (Scope 1-3)* in 2023 were approximately 7.47 million tons. Chiefly as a result of actions to conserve energy, increased use of renewable energy, and the switch to electricity with lower CO2 emissions, we achieved a reduction of approximately 870,000 t-CO2 over the entire product lifecycle. The resources (input) that Canon used in its business activities and emissions (output) to the global environment over the entire product lifecycle are as shown in the following chart.
- * Scope 1: Direct GHG emissions (combustion of city gas, LPG, light oil, kerosene, non-energy-derived GHG, etc.)
- Scope 2: Indirect GHG emissions (consumption of electricity, steam, etc.)
- Supply chain-related GHG emissions (production of purchased goods and services [Category 1], upstream transportation and distribution [Category 4], use of sold products [Category 11])
Lifecycle GHG Emissions (CO2 Equivalent)


Scope 3 GHG Emissions in 2023
| Category | Scope | 2023 (1,000 t-CO2e) |
Calculation Method |
|---|---|---|---|
| 1 | Purchased goods and services | 2,903 | Calculated by multiplying the weight of each material input (including any inputs emitted as waste) by the emission factor for each material/process. |
| 2 | Capital goods | 883 | Calculated by multiplying the total amount of each asset category of purchased capital goods by the emission factor for each asset category. |
| 3 | Fuel- and energy-related activities not included in Scope 1 or Scope 2 | 180 | Calculated by finding the total for fuel and electricity usage at each operational site and then multiplying it by the emission factor from fuel extraction to burning and power generation. |
| 4 | Upstream transportation and distribution | 357 | Logistics from the supplier to Canon production sites is calculated by finding the average transport distance and transport volume and then multiplying it by the emission factor for transportation. Logistics from production site to customer’s warehouse is calculated by multiplying the emission factor of transportation by logistics performance data. |
| 5 | Waste generated in operations | 23 | The total weight of waste generated by material and disposal process at each operational site is derived and then multiplied by the end-of-life treatment emission factor. |
| 6 | Business travel | 58 | The emission factor for each transportation method is multiplied by the total payment amount for each transportation method. For business travel using a personal vehicle, the total payment amount is converted to fuel usage and then multiplied by the emission factor for fuel consumption. |
| 7 | Employee commuting | 147 | The emission factor for each transportation method is multiplied by the total payment amount for each transportation method. For commutes by private vehicle, total fuel usage is derived from amounts paid and then multiplied by the emission factor for fuel consumption. |
| 8 | Upstream leased assets | 0 | CO2 emissions from leased buildings and vehicles are applicable, but both are included in Scope 1 and Scope 2. |
| 9 | Downstream transport and distribution | 50 | Average transport distance and weight of transported products is calculated for each region and multiplied by the emission factor for transportation. |
| 10 | Processing of sold products | 0 | Emissions from production by outsourcing partners of intermediate products used in sale of Canon-branded products are included in Category 1. |
| 11 | Use of sold products | 1,786 | Lifetime energy usage is calculated for each product and then multiplied by the average electricity emission factor. |
| 12 | End-of-life treatment of sold products | 165 | Sold products are categorized by material and then the emission factor of end-of-life treatment is multiplied by each based on the volume of materials used. |
| 13 | Downstream leased assets | 1 | Leased assets such as multifunction devices are included in Category 11 above together with sold products. |
| 14 | Franchises | 0 | Not applicable |
| 15 | Investments | 0 | Not applicable |
| Scope 3 | 6,551 |
2023 Material Balance
Canon compiles data for greenhouse gas (GHG; energy-derived greenhouse gas CO2, and non-energy derived greenhouse gases PFCs, HFCs, SF6, N2O, methane, and NF3). For CO2 emission factors for electricity, figures provided by individual electric supply companies are used, but publicly disclosed region-specific figures are used when figures are not provided by electric supply companies (Please refer to the website for the operational sites included in aggregation: https://global.canon/en/sustainability/data/pdf/data-2024-e.pdf. For figures on customer use, electricity consumption of products shipped in a given year is calculated based on the average lifetime and printing volume, and converted to the CO2 equivalent using CO2 emission factors for electricity, which are calculated in the same way as the above methods. Past data may be revised due to improvements in the precision of data collection.
| Data Summary (105KB) |
Third-party Verification of GHG Emissions (Converted to CO2)
Third-party verification has been obtained for CO2 emissions data appearing in “2023 Material Balance” and “Lifecycle GHG Emissions (CO2 Equivalent)” in 2022/2023 and for each figure in “Scope 3 GHG Emissions in 2023.”
Environmental Regulatory Compliance and Response to Complaint
As a result of implementing an environmental management system coordinated across the Group, Canon came through 2023 without a single legal violation or accident that seriously impacted the environment, including incidents relating to water quality or quantity permits. Although there were some complaints about noise at our operational sites, all issues were resolved satisfactorily via appropriate measures.