We aim to achieve net-zero CO2 emissions for the whole product lifecycle* by 2050.
* Scope 1: Direct GHG emissions (combustion of city gas, LPG, light oil, kerosene, non-energy derived GHG, etc.)
Scope 2: Indirect GHG emissions (consumption of electricity, steam, etc.)
Scope 3: Supply chain-related GHG emissions (production of purchased goods and services [Category 1], upstream transportation and distribution [Category 4], use of sold products [Category 11])
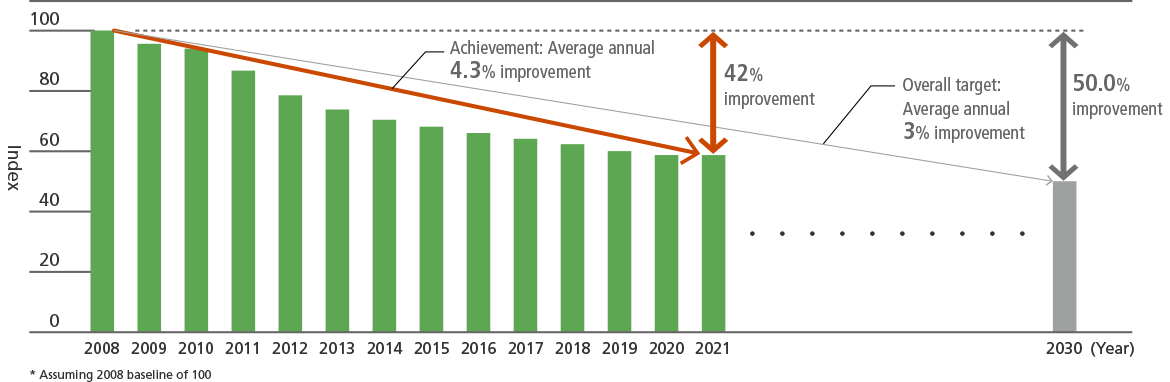
Canon aims to consistently achieving the environmental targets of an average annual 3% improvement, in the index of lifecycle CO2 emissions per product unit set in 2008, and realize a cumulative total 50% improvement by 2030.
In addition, we aim to reduce absolute scope 1 and 2 GHG emissions 42% and absolute scope 3 GHG emissions (category 1 and 11) 25% by 2030 from a 2022 base year in line with the SBTi’s criteria (Canon has submitted these targets to the SBTi for official validation.).
*SBTi (Science Based Targets initiative ): The Science Based Targets initiative is a global body enabling businesses and financial institutions to set ambitious emissions reductions targets in line with climate science.
| 2021–2023 Medium-term Environmental Targets | 2021 Achievements | 2022–2025 Medium-term Environmental Targets | |
|---|---|---|---|
| Overall (Lifecycle) |
3%-per-year average improvement in lifecycle CO2 emissions improvement index per product | Avg. improvement: 4.3% p.a. (2008–2021) |
3%-per-year average improvement in lifecycle CO2 emissions improvement index per product |
| Products | 3%-per-year average improvement in raw materials and use CO2 emissions improvement index per product | Avg. improvement: 2.6% p.a. (2008–2021) |
3%-per-year average improvement in raw materials and use CO2 emissions improvement index per product |
| 2021 Environmental Targets | 2021 Achievements | 2022 Environmental Targets | |
| Operational Sites | Improve energy consumption per basic unit at operational sites* (excluding marketing sites) by 1.2% (compared to 2020) | 8.0% improvement over 2020 | Improve energy consumption per basic unit at operational sites* (excluding marketing sites) by 1.2% (compared to 2021) |
| Improve total waste generation per basic unit at operational sites* (excluding marketing sites) by 1% (compared to 2020) | 4.9% improvement over 2020 | Improve total waste generation per basic unit at operational sites* (excluding marketing sites) by 1% (compared to 2021) | |
| Improve water usage per basic unit in production* (excluding marketing sites) by 1% (compared to 2020) | 5.4% improvement over 2020 | Improve water usage per basic unit in production* (excluding marketing sites) by 1% (compared to 2021) | |
| Improve emissions of controlled chemical substances per basic unit at operational sites* (excluding marketing sites) by 1% (compared to 2020) | 1.0% improvement over 2020 | Improve emissions of controlled chemical substances per basic unit at operational sites* (excluding marketing sites) by 1% (compared to 2021) |
* The basic unit denominator is decided according to the characteristics of each operational site (production volume, effective floor area, workforce, etc.)
Against the target of a 3% average annual improvement in the index of lifecycle CO2 emissions per product unit, we realized an average annual improvement of 4.3% between 2008 and 2021 for a cumulative total improvement of 42%. In 2021, we progressed with related activities, including initiatives in both operations and product design to improve energy efficiency based on the whole product lifecycle. Unfortunately, disruption of logistics operations owing to COVID-19 and other factors limited the rate of achievable improvement. However, the disruption is temporary and we expect to return to a path of continuous improvement.
Total product lifecycle CO2 emissions (Scope 1-3)*1 in 2021 were approximately 7.62 million tons.
CO2 emissions from raw materials decreased from 2020 due to delays in parts supply caused by COVID-19. On the other hand, operational site emissions increased due to a recovery in production, and logistics CO2 also increased due to the impact of logistics disruptions caused by COVID-19. As a result, energy and resource conservation efforts resulted in a reduction of approximately 70,000 t-CO2 over the entire product lifecycle.
*1 Scope 1: Direct GHG emissions (combustion of city gas, LPG, light oil, kerosene, non-energy derived GHG, etc.)
Scope 2: Indirect GHG emissions (consumption of electricity, steam, etc.)
Scope 3: Supply chain-related GHG emissions (production of purchased goods and services [Category 1], upstream transportation and distribution [Category 4], use of sold products [Category 11])
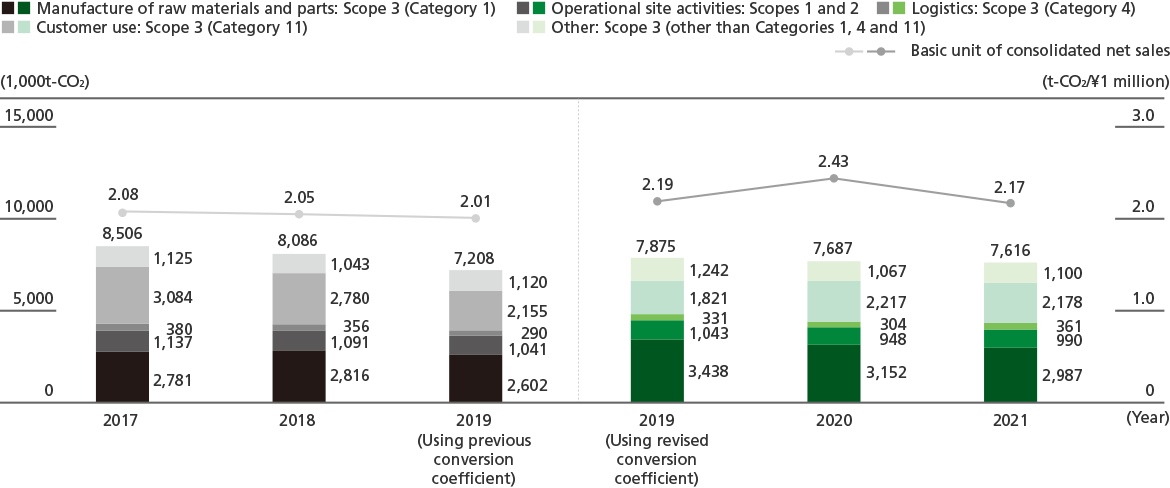
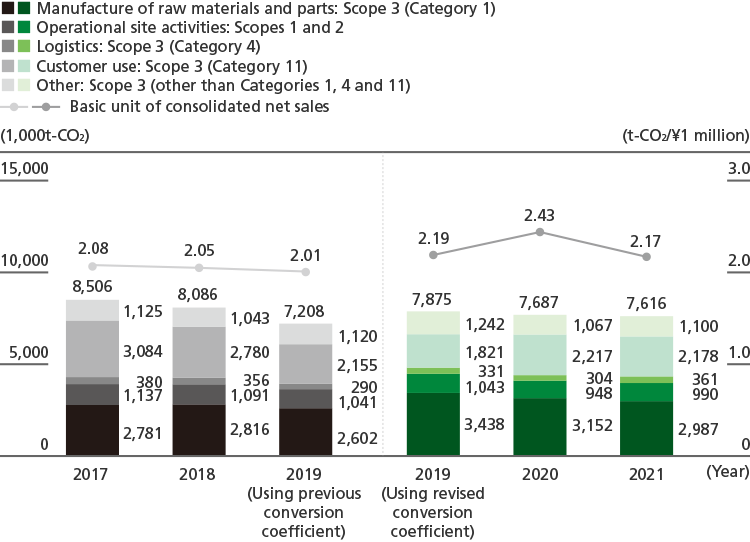
* Change in CO2 conversion coefficient: Following the merging of the Carbon Footprint Communication Program and the Eco-Leaf Environmental Label into the Eco-Leaf Environmental Label Program, from 2020 the CO2 conversion coefficient used for raw materials and processing is that of the latter program (figures up to 2019 are calculated using that of the former program). The CO2 conversion coefficient used for logistics operations reflects the changes adopted by the Clean Cargo Working Group (CCWG)
| Category | Scope | 2021 (1,000 t-CO2e) | Calculation Method |
|---|---|---|---|
| 1 | Purchased goods and services | 2,987 | Calculated by multiplying the weight of each material input (including any inputs emitted as waste) by the emission factor for each material/process. |
| 2 | Capital goods | 525 | Calculated by multiplying the total amount of each asset category of purchased capital goods by the emission factor for each asset category. |
| 3 | Fuel- and energy-related activities not included in Scope 1 or Scope 2 | 158 | Calculated by finding the total for fuel and electricity usage at each operational site and then multiplying it by the emission factor from fuel extraction to burning and power generation. |
| 4 | Upstream transportation and distribution | 361 | Logistics from the supplier to Canon production sites is calculated by finding the average transport distance and transport volume and then multiplying it by the emission factor for transportation. Logistics from production site to customer’s warehouse is calculated by multiplying the emission factor of transportation by logistics performance data. |
| 5 | Waste generated in operations | 3 | The total weight of waste generated by material and disposal process at each operational site is derived and then multiplied by the end-of-life treatment emission factor. |
| 6 | Business travel | 38 | The emission factor for each transportation method is multiplied by the total payment amount for each transportation method. For business travel using a personal vehicle, the total payment amount is converted to fuel usage and then multiplied by the emission factor for fuel consumption. |
| 7 | Employee commuting | 144 | The emission factor for each transportation method is multiplied by the total payment amount for each transportation method. For commutes by private vehicle, total fuel usage is derived from amounts paid and then multiplied by the emission factor for fuel consumption. |
| 8 | Upstream leased assets | 0 | CO2 emissions from leased buildings and vehicles are applicable, but both are included in Scope 1 and Scope 2. |
| 9 | Downstream transport and distribution | 44 | Average transport distance and weight of transported products is calculated for each region and multiplied by the emission factor for transportation |
| 10 | Processing of sold products | 0 | Emissions from production by outsourcing partners of intermediate products used in sale of Canon-branded products are included in Category 1. |
| 11 | Use of sold products | 2,178 | Lifetime energy usage is calculated for each product and then multiplied by the average electricity emission factor. |
| 12 | End-of-life treatment of sold products | 187 | Sold products are categorized by material and then the emission factor of end-of-life treatment is multiplied by each based on the volume of materials used. |
| 13 | Downstream leased assets | 0 | Leased assets such as multifunction devices are included in Category 11 above together with sold products. |
| 14 | Franchises | 0 | Not applicable |
| 15 | Investments | 0 | Not applicable |
| Scope 3 | 6,626 |
Canon compiles data for greenhouse gas (GHG; energy-derived greenhouse gas CO2, and non-energy derived greenhouse gases PFCs, HFCs, SF6, N2O, methane, and NF3) designated under the Kyoto Protocol (revised version).
For CO2 emission factors for electricity, figures provided by individual electric supply companies are used, but publicly disclosed region-specific figures are used when figures are not provided by electric supply companies. As the latest CO2 conversion coefficients become public after compilation of CO2 data for the report, the data are adjusted retroactively in subsequent reports. For figures on customer use, electricity consumption of products shipped in a given year is calculated based on the average lifetime and printing volume, and converted to the CO2 equivalent using CO2 emission factors for electricity, which are calculated in the same way as the above methods. Past data may be revised due to improvements in the precision of data collection.
Third-party verification has been obtained for CO2 emissions data and basic unit of consolidated net sales appearing in “2021 Material Balance” and “Lifecycle GHG Emissions (CO2 Equivalent)” in 2020/2021 and for each figure in “Scope 3 GHG Emissions in 2021.”
We continued with initiatives, including efforts to make products more compact, lightweight, and energy efficient, and achieved an average annual improvement of 2.8% (2008–2021) in raw materials and use CO2 emissions per product, falling just short of our target of 3%.
・Energy consumption per basic unit at operational sites
We are working to reduce energy consumption at operational sites by consistently meeting our target for reduction of consumption per basic unit.
In 2021, energy consumption per basic unit improved by 8.0% over the previous year, exceeding the 1.2% improvement target.
・Total waste generation per basic unit
We are working to reduce total waste emissions by consistently meeting our target for reduction of emissions per basic unit.
As a result of such initiatives as reducing waste at production sites and recycling waste reducing waste at production sites and recycling waste target of a 1.0% improvement with a 4.9% reduction in total waste generation over 2020.
・Water usage per basic unit in production
We are working to reduce water consumption by consistently meeting our target for reduction of consumption per basic unit.
Water usage per basic unit of production declined by 5.4% compared to 2020 on the strength of efforts to improve water management. This means that we successfully met our target of a 1.0% improvement.
・Emissions of controlled chemical substances per basic unit
We are working to reduce emissions of controlled chemical substances by consistently meeting our target for reduction of emissions per basic unit.
We achieved a 1.0% improvement over 2020 in emissions of controlled chemical substances per basic unit, attaining our target of a 1.0% improvement, by reducing chemical substances used in manufacturing processes and reusing materials.
* The chemical substances handled during manufacturing at Canon include “controlled chemical substances” regulated in terms of safety such as negative impact on human health, the environment, and flammable risk.