Climate Change
Basic Approach / Targets and Achievements
Canon is working to reduce GHG emissions at all stages of the product life cycle.
Canon seeks to consistently meet its environmental targets and, beyond that, is working toward net-zero CO2 emissions from its business activities by 2050. To that end, we quantify emissions during the whole product lifecycle—from the upstream supply of raw materials and parts through operational site activities and logistics to customer use—and use technology to reduce emissions at each stage.
For 2050
We aim to achieve net-zero GHG emissions for entire product life cycle (Scope 1-3) by 2050.
2030 Targets
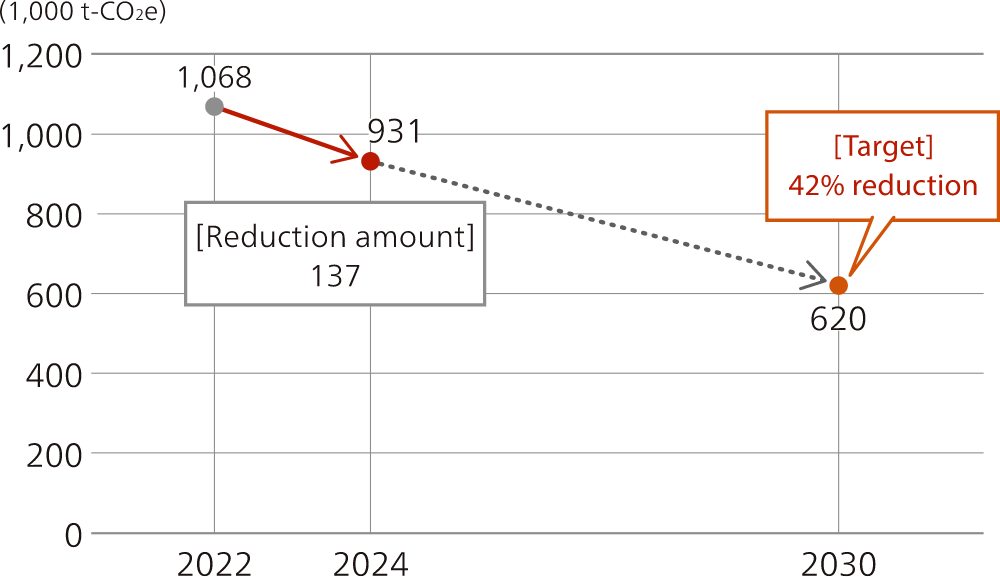
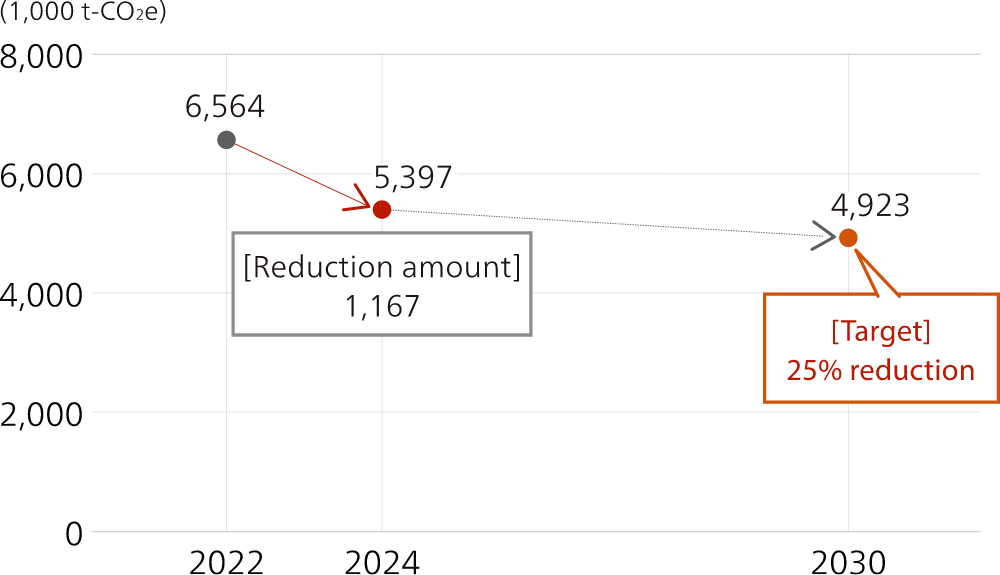
- Reduce Scope 1 & 2 GHG emissions by 42% compared to 2022, reduce Scope 3 (category 1 and 11) GHG emissions by 25% compared to 2022.
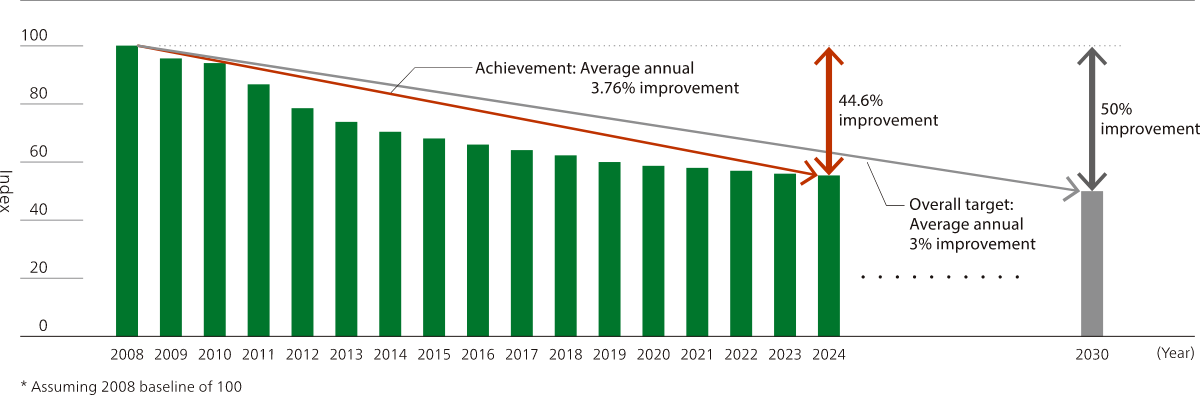
- Work toward a 3% average annual improvement in the index of life cycle CO2 emissions (per product unit), realizing a cumulative improvement of 50% compared to 2008 by continually achieving this target.
GHG Emissions Reduction (Diagram)
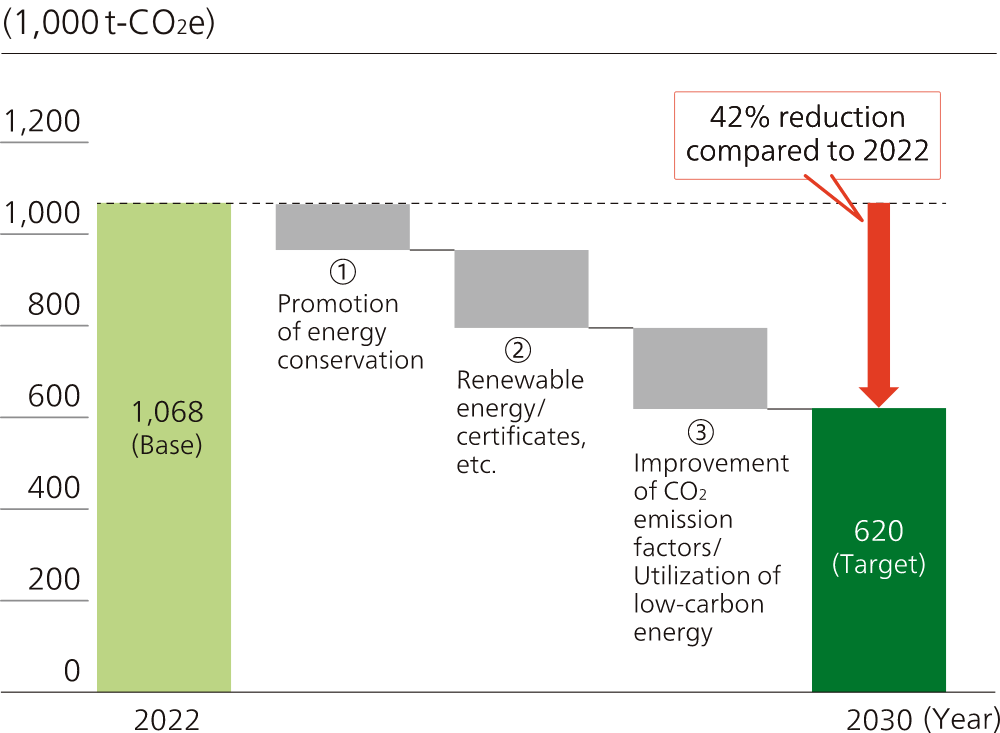
Scope 1 & 2
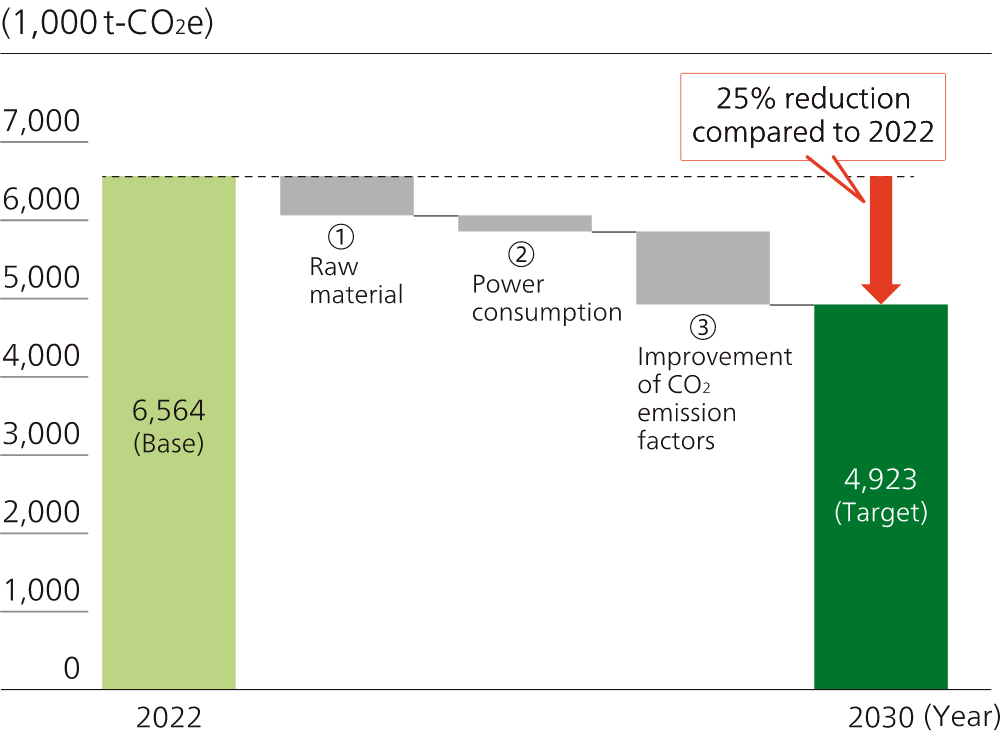
Scope 3 (Categories 1, 11)
- Scope 1: Direct emissions (city gas, LPG, diesel oil, kerosene, non-energy greenhouse gases, etc.)
- Scope 2: Indirect emissions (electricity, steam, etc.)
- Scope 3: Emissions in the supply chain (category 1: Purchased goods and services, category 11: Use of products sold)
Canon's GHG Emissions-reduction Initiatives
Canon is working to reduce greenhouse gas emissions by assessing the impact of climate change on the entire product life cycle, from the manufacturing of materials and parts at suppliers, transportation to retailers, use by customers, and disposal and recycling.
Canon aims to achieve net zero GHG emissions by 2050, and to reduce its scope 1 and 2 GHG emissions by 42% compared to 2022 and scope 3 (category 1 and 11) GHG emissions by 25% compared to 2022 by 2030. These targets for 2030 have been verified by SBTi, an international initiative that recommends setting scientifically based GHG emissions reduction targets.
To this end, we are promoting various initiatives, including the development of products using recycled materials, product downsizing and weight reduction, energy-saving activities at production sites, energy saving during product use, product recycling, and efficient logistics.
Acceptance of TCFD Recommendations
Canon accepts the recommendations of the final report of the Task Force on Climate-related Financial Disclosures (TCFD). Our disclosures of climate-related information are in accordance with the TCFD framework.
Governance
The impact of climate change on Canon, response plans and targets were discussed at the Climate Change Working Group (WG) under the Sustainability Committee. The Climate Change Working Group is comprised of senior managers from each business and corporate division. The content of discussions is reported to the Sustainability Committee, and after approval, it is reported to the CEO.
To achieve these targets, the Sustainability Headquarters plays a central role in promoting activities throughout Canon. The progress of targets is reported to the management every month, and the annual review is reported to the CEO.
Global Environmental Promotion System
Strategy
Canon conducts scenario analysis based on the TCFD framework, which is recommended in non-financial disclosures, and recognizes the importance of both "mitigation" and "adaptation" to physical risks for Canon. We are working to achieve our GHG emissions reduction targets and build a sustainable business model resilient to climate-related impacts.
Scenarios Referenced for Analysis
In the scenario analysis, Canon selected the "current scenario," in which economic activities are conducted in line with current policies, and the "1.5°C scenario," in which the world will control greenhouse gas emissions and policies and technological development related to climate change will progress faster than the current speed toward achieving net zero by 2050, on the premise that the targets of the Paris Agreement will be achieved. The scenarios referred to are as follows.
- Current Scenario:
(Transition risk) IEA APS, NGFS Current Policies
(Physical risk) IPCC RCP8.5 - 1.5°C Scenario:
(Transition risk) IEA NZE, NGFS Net Zero 2050
(Physical risk) IPCC RCP2.6
Factors such as climate-related policies, laws and regulations, technological developments, changes in customer behavior, and market conditions in the major regions where Canon operates are also taken into account.
Definition of Time Frame and Degree of Impact
As shown in the following table, the time frame is examined in a manner consistent with the Canon's medium to long-term management plan. The degree of impact is examined in three stages of extremely important, important and minor.
Time Frame
| Category | Period |
|---|---|
| Short term | To 2025 |
| Medium term | To 2030 |
| Long term | After 2030 |
Degree of Impact
| Category | Impact on sales |
|---|---|
| Extremely important | May cause fluctuations in net sales by ±10% or more |
| Important | May cause fluctuations in net sales by ± 5% to 10% |
| Minor | Impact of less than ± 5% on sales |
- * The impact criteria for each group is judged based on the sales of Canon.
Business Environment Assumptions under the Current / 1.5°C Scenario
As climate-related risks and opportunities differ among the businesses of Canon's industrial groups (printing, medical, imaging and industrial), Canon reviewed the major climate-related risks and opportunities, their countermeasures and financial impact for the entire Canon and each group.
Under the Current Scenario, the business environment is expected to include the continuation of existing climate-related regulations, the introduction of carbon pricing, the spread of recycled materials and bioplastics, the introduction of a modal shift, the expansion of customer demand for decarbonization and purchasing behavior conscious of climate change response, and the introduction of industrial policies for decarbonization in each country. Under the 1.5°C scenario, the aforementioned environment will become even more severe and develop, and the movement toward carbon neutrality throughout the supply chain will accelerate.
Risk and Opportunity Factors Affecting Canon and Estimated Financial Impact
Risks and opportunities relating to the transition to a decarbonized economy are outlined below.
Transition Risks
Policies and laws and regulations
- Increased cost for carbon pricing
- Sales decrease when regulations cannot be met
- Increase in capital investment to comply with regulations
Market
- Increased costs due to the adoption of recycled materials
- Sales decrease when other companies' products become dominant
- Sales decrease when the price pass-through of costs for responding to climate change is not accepted
Technology
- Increased research and development expenses to respond to climate change
Reputation
- Sales decrease due to growing concerns of stakeholders when climate-change measures are not sufficient
Opportunities
Resource efficiency
- Cost reduction due to energy efficiency improvement
- Lower distribution costs due to joint distribution and modal shift
Market
- Sales increased due to the improvement of evaluation by stakeholders
- Diversify fund procurement
Energy source
- Lower carbon pricing impact due to the use of low-carbon energy
Products / Services
- Sales of GX related products and recycling-oriented products increased
- Increase sales of low-carbon products
- Sales increase of products for which the Guidelines are applied
Details of Transition Risks and Opportunities — Company-wide
The scenario analysis revealed that carbon pricing is a risk factor that could affect the entire company. Based on the emissions forecasts for scopes 1, 2 and 3 of Canon, the impact of the introduction of carbon pricing in 2030 and beyond is estimated to be approximately 8.3 to 44.5 billion yen in 2030 and approximately 4.3 to 40.3 billion yen in 2050, using the current scenario and the 1.5˚C scenario. As a risk management measure, we are working to decarbonize through the development of green technology. For example, at each of our sites, we have been working to reduce electricity consumption during production in three steps: visualizing electricity consumption, analyzing potential reduction, and implementing reduction measures. These efforts include breaking down electricity consumption into the operational units of production equipment, such as transportation and processing, to identify hidden waste and highlight targets for improvement. The estimated reduction in electricity costs is estimated to be approximately 4.5 to 5.7 billion yen in 2030 and approximately 9.7 to 12.1 billion yen in 2050, and it was confirmed that it will also have a positive impact. We are also addressing climate change in logistics in consideration of the characteristics of each business, and we see the results of these efforts as an opportunity.
Furthermore, the Company is working on reducing CO2 emissions (Scope 3 Category 1) in raw material procurement on a company-wide basis, and is considering low-carbon materials in procurement and preparing for future procurement. We have introduced life cycle assessment (LCA) methods in product development, such as incorporating actual data on the CO2 emissions of raw materials and parts collected from our business partners into LCA, and are aiming to reduce the environmental impact throughout the product life cycle.
If taking sufficient measures to address climate change are not be implemented, the Company recognizes the risk of a deterioration in reputation due to an increase in concerns of stakeholders who place importance on responding to climate change and a decrease in sales due to a loss of sales opportunities. As a countermeasure, the Company will continue to promote effective climate-change initiatives and make timely and appropriate disclosures to stakeholders. Furthermore, the Company recognizes that appropriate disclosure of its response to climate change will improve the understanding and evaluation of stakeholders, including investors and customers, and that it will also provide opportunities to diversify its financing by meeting the investment and financing requirements of financial institutions.
Details of Transition Risks and Opportunities — by Industry and Group
Analysis by industry group revealed that the printing business is expected to be affected by climate-related regulations in the electrical and electronics industries, changes in consumer preferences, competition with competitors, etc. However, risk reduction measures such as understanding regulatory trends, research and development and capital investment to respond to regulations, and acquisition of procurement requirements have already been incorporated into the plan, and as a result of trial calculations, it was confirmed that there will be no significant impact under either the current scenario or the 1.5˚C scenario. We expect the positive impact of increased sales opportunities due to increased demand for low-carbon products and cost reductions due to energy efficiency improvements to be an opportunity.
In the Medical Business, there are cases where bidding requirements include power saving due to the increasing interest in sustainability mainly among customers in Europe. In the Imaging and Industrial businesses, although regulations and customer demands are relatively low at present, demands may increase in the future. Therefore, we have made trial calculations assuming the possibility that new research and development and capital investment will be required. The results showed that, although there was a risk of increased costs, the impact was relatively small as we have started to investigate trends in laws and regulations and take initiatives to improve energy efficiency in the regions where it operates. We believe that there are more opportunities in terms of reducing costs through energy efficiency improvements, and increasing sales opportunities for products that contribute to adaptation to climate change using existing technologies and products that match the industrial promotion measures of each country such as the GX-related policies.
Transition Risks (Company-wide and Group by Industry)
| Transition risk classification |
Risk factors | Corporate / group | Financial impact | Expression time | Impact degree |
Measures |
|---|---|---|---|---|---|---|
| Policy Laws and regulations | Carbon pricing | Entire company | Increase in response costs | Mid-term to Long-term | Minor |
|
| Strengthening the response to climate-related regulations for existing products | Printing | Decrease in sales when we fail to respond | Short-term to Long-term | Minor |
|
|
| Printing | Increase in research and development expenses for responding to regulations and capital investment | Short-term to Long-term | Minor |
|
||
| Medical | Increase in costs due to responding to regulations | Long-term | Minor |
|
||
| Industrial | Decrease in sales when we fail to respond | Long-term | Minor |
|
||
| Technology | Strengthening of customer's needs for climate-change response | Medical | Decrease in sales when we fail to respond | Long-term | Minor |
|
| Industrial | Sales decrease due to restrictions and curtailment of transactions in the event that the Company fails to respond to the above | Long-term | Minor |
|
||
| Market | Spread of recycled materials | Printing | Increase in raw material costs due to the use of recycled materials | Short-term to Long-term | Minor |
|
| Comparison with competitors | Printing | Decrease in sales when products show higher life cycle CO2 emissions than that of competitor's products | Short-term to Long-term | Minor |
|
|
| Changes in customer preferences | Imaging | Decrease in sales when customers do not accept price pass-through for the cost of addressing climate change | Long-term | Minor |
|
Opportunities (Company-wide and Industrial Group)
| Opportunities classification |
Opportunity factor | Corporate / group | Financial impact | Expression time | Impact degree |
Measures |
|---|---|---|---|---|---|---|
| Resources efficiency | Improvement of energy efficiency | Entire company | Cost reduction due to reduction of power costs | Short-term to Long-term | Minor |
|
| Lower distribution costs | Entire company | Lower distribution and selling, general and administrative expenses through joint distribution and modal shift | Short-term to Long-term | Minor |
|
|
| Energy source | Switch to low-carbon energy | Entire company | Cost reduction due to reduction of carbon pricing impact | Mid-term to Long-term | Minor |
|
| Products / services | Increasing demand for low-carbon products | Printing | Sales increase due to increase in sales opportunities | Short-term to Long-term | Minor |
|
| Increase in sales due to changes in customer preferences | Medical | Sales increase due to increase in sales opportunities | Short-term to Long-term | Minor |
|
|
| Increasing demand for products that help adapt to climate change | Imaging | Sales increase due to increase in sales opportunities | Mid-term to Long-term | Minor |
|
|
| Increasing demand for semiconductor manufacturing equipment due to increase of governmental promotional measures for GX | Industrial | Sales increase due to increased demand for semiconductors as a result of the GX Project | Short-term to Long-term | Important |
|
|
| Increase in sales due to changes in customer preferences | Industrial | Sales increase due to increase in sales opportunities | Short-term to Long-term | Minor |
|
Physical Risks (Risks Associated With Climate Change)
Canon's facilities and offices are located around the world, and natural disasters caused by climate change could affect its businesses. As for physical risks associated with climate change, we have verified the risks of river flooding, storm surge, and storm wind at major bases in Japan and overseas using analysis tools such as the World Resources Institute's Aqueduct, local government hazard maps, and XDI's natural disaster risk analysis service. As a result, we have found that four of our production bases and offices in Japan and overseas have medium or high risks of river flooding and storm surge. However, we have already implemented necessary measures according to the situation of the bases, such as installing water stop boards, remodeling rainwater pipes, and raising the block height of the outer fence. The assets of these four bases account for approximately 3% of the total assets of Canon.
Going forward, the Company will continue to consider various measures to reduce the impact of damage and loss from natural disasters.
Results of Scenario Analysis
In the value chain, especially in research and development, procurement and sales, it was clarified through scenario analysis that there are impacts from research and development due to strengthening regulations, fluctuations in raw material prices, and customers' and business partners' views and demand trends for low-carbon products.
If no measures are taken, financial risks such as missed sales opportunities and cost increases may occur in either scenario. Although these are risks that should be considered, we have already incorporated measures to reduce risks into our plan, such as understanding regulatory trends, research and development and capital investment to respond to regulations, and acquisition of procurement requirements. Through multiple patterns of financial simulations conducted under each scenario, it was confirmed that there were no measures that would have a significant impact on the financial results, including measures currently being implemented and those that are being planned. Therefore, the impact was judged to be limited, and it was reconfirmed that there was no shortage in the measures that had been implemented and that the direction of the initiatives at products and production sites was correct.
In addition, in a world where the transition to decarbonization is progressing, we expect a positive impact from changes in consumer preferences, increased demand for adaptive products, and increased sales of low-carbon products and adaptive products of Canon due to the progress of industrial measures for the promotion of the GX, products contributing to the promotion of the GX, and cost reductions associated with energy efficiency improvements.
Through scenario analysis, we have confirmed that the impact of climate change on the financial performance, including sales and operating income, the financial position and cash flow of the entire Canon and major businesses will be limited in the short, medium and long term, and that there is no need to revise the portfolio and business model.
However, we are aware that the introduction of carbon pricing and climate-related regulations could affect Canon's financial performance and the entire value chain, due to increased response costs, research and development expenses, and capital expenditures. We will continue to monitor the business environment while analyzing the impact on climate-related risks and opportunities.
Risk Management
Our response to climate-related risks and opportunities is reflected in our company-wide environmental targets and priority measures. At Canon, environmental initiatives are part of our management evaluation.
The status of achievement of environmental targets and the results of environmental activities of each division are evaluated twice a year in the Environmental and Corporate Social Responsibility Performance Evaluation, which is implemented as an indicator of the Consolidated Performance Evaluation System for evaluating the performance of Canon's overall management. The results of the evaluation are reported to the CEO and other management. Identified climatic risks are managed in accordance with the PDCA cycle of ISO14001.
Environmental Management System
Indicators and Targets
Canon aims to reduce its GHG emission throughout the product life cycle to net zero by 2050. To achieve this goal, we have set an overall target to reduce Scope 1 and 2 GHG emissions by 42% in 2030 compared to 2022, and reduce Scope 3 (categories 1 and 11) GHG emissions by 25% compared to 2022. In November 2023, these targets were approved by SBTi.
Since 2008, we have set a target of "an average improvement in life cycle CO2 emissions per unit of product of 3% per year" (basic unit target) as a comprehensive target of Canon's environmental targets. By consistently achieving this target, we expect to achieve a 50% improvement in 2030 compared to 2008. In 2024, the annual average was 3.76%, exceeding the target, and an improvement of 44.6% compared to 2008.
During the fiscal year ended March 31, 2018, the actual life cycle CO2 emissions (the total of Scopes 1, 2 and 3) were 8,104,000 t-CO2e, with Scope 1 emissions of 198,000 t-CO2e, Scope 2 emissions of 733,000 t-CO2e and Scope 3 emissions of 7.173 million t-CO2e. We will continue to achieve these targets in the next fiscal year and beyond.
In 2024, in terms of SBTi, through the promotion of various energy-saving measures, the introduction of renewable energy, the adoption of smaller, lighter, and low-carbon emission components, we achieved a reduction of 12.8% in Scope 1 and 2, and 17.7% in Scope 3 (categories 1 and 11) compared to 2022.
In Canon, the environmental targets are set in line with our three-year management plan and reviewed every year to determine whether changes are necessary. Under the overall target of a 3% average annual improvement in the index of life cycle CO2 emissions per product unit, our product target is a 3% average annual improvement in the index of CO2 emissions per product unit associated with raw materials and product utilization. The operational site target includes target figures for reductions per basic unit in energy consumption.
As for the operational site target, we also set goals for total waste emissions, water consumption, and controlled chemical substance emissions, thus making the management of environmental risks and opportunities more comprehensive and conclusive.
Environmental Targets and Achievements
| 2030 Targets | 2024 Achievements* | |
|---|---|---|
| GHG emissions (compared to 2022) |
42% reduction for Scope 1 & 2 25% reduction for Scope 3 (category 1 and 11) |
Scope 1 & 2: 12.8% reduction Scope 3: 17.7% reduction |
- * For scope of data collection
Environmental Performance Data
GHG Emissions
Scope 1 & 2
Scope 3 (category 1, 11)
- * Results in the base year (2022) have been recalculated in accordance with the SBTi.
- * Calculations are based on the Sixth Assessment Report of the Intergovernmental Panel on Climate Change (IPCC).
Progress Relative to Overall Target
In 2024, we made progress with ongoing improvement in product life cycle emissions via upgraded site-based energy-efficiency measures; greater adoption of renewable energy sources; development of better energy-efficient products; reduced use of air freight; and other measures. As a result, against the target of a 3% average annual improvement in the index of life cycle CO2 emissions per product unit, we realized an average annual improvement of 3.76% between 2008 to 2024 and total improvement of 44.6% from 2008.
Achievement of Product Targets
We continued with initiatives, including efforts to make products more compact, lightweight, and energy efficient, and achieved an average annual improvement of 2.22% (2008–2024) in raw materials and use CO2 emissions per product, falling just short of our target of 3%.
Achievement of Operational Site Targets
Improvement in Energy Consumption Per Basic Unit at Operational Sites
Due to more efficient production and other factors, overall energy consumption per basic unit improved by 4.6% in 2024, exceeding the 2.4% improvement target. We aim to meet this target again in 2025 by reducing energy consumption and further improving production efficiency.
Improvement in Total Waste Generation
Owing to ongoing improvement measures at each site, such as reducing packaging materials by using returnable boxes and reducing the use of evaluation sheets, total waste generation per basic unit improved by 2.2% in 2024, exceeding the 1% improvement target. In 2025, we will aim to continuously achieve our targets by advancing collaborative activities with partners, such as reducing packaging for procured materials.
Improvement in Water Usage Per Basic Unit in Production
Due to factors including equipment maintenance and greater cooling water usage due to high temperatures, water usage per basic unit improved by 0.6%, missing the 1% improvement target. In 2025, we will move ahead with actions to meet the improvement target, including raising the efficiency of the cleaning process for manufacturing equipment.
Improvement in Emissions of Controlled Chemical Substances Per Basic Unit
Due to factors including an increase in parts cleaning, emissions of controlled chemical substances per basic unit fell by 0.9%, missing the 1% improvement target. In 2025, we will move ahead with actions to meet the improvement target, including review of chemical substance use conditions and operating conditions of detoxification equipment.
2025 Targets
Unchanged from 2024.
| 2030 Targets | 2024 Achievements*2 | |
|---|---|---|
| Improvement in per-unit Life cycle CO2 emissions index (compared to 2008) | 50% improvement | 44.6% improvement |
| 2024-2026 Targets | 2024 Achievements*2 | |
|---|---|---|
| Overall (Life cycle) | 3%-per-year average improvement in Life cycle CO2 emissions improvement index per product | Average annual 3.76% improvement (2008-2024) |
| Products | 3%-per-year average improvement in raw materials and use CO2 emissions improvement index per product | Average annual 2.22% improvement (2008-2024) |
| 2024 Targets*1 | 2024 Achievements*2 | |
|---|---|---|
| Operational Sites | Energy consumption per basic unit: 2.4% improvement | 4.6% improvement |
- *1 Calculation based on average annual improvement rate of the three most recent years. For energy consumption at Japanese operational sites, however, calculation as stipulated in Act on Rationalizing Energy Use. The basic unit denominator is decided according to the characteristics of each operational site (production volume, effective floor area, workforce, etc.)
- *2 For scope of data collection
Environmental Performance Data
Index of Life Cycle CO2 Emissions Per Product Unit
Overview of Environmental Impacts
GHG emissions for entire product life cycle (Scope 1-3)* in 2024 were approximately 8.10 million t-CO2e. Chiefly as a result of actions to conserve energy, increased use of renewable energy, and the switch to electricity with lower CO2 emissions, we achieved a reduction of approximately 300,000 t-CO2e over the entire product life cycle. The resources (input) that Canon used in its business activities and emissions (output) to the global environment over the entire product life cycle are as shown in the "2024 Material Balance".
Life Cycle CO2 Emissions
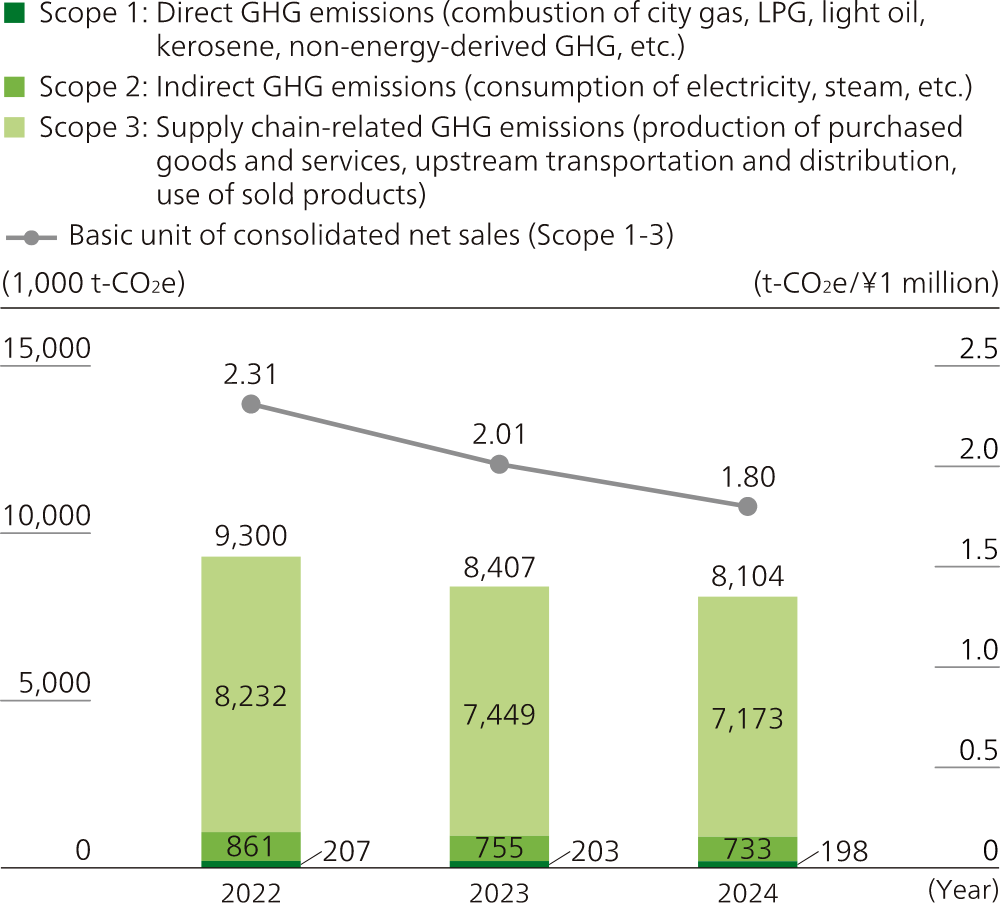
- * Data for 2024 has been third-party assured. In addition, some of the data for 2022 and 2023 has been recalculated in line with the 2024 calculation method.
GHG Emissions in 2024
| Category | Scope | 2024 (1,000 t-CO2e) |
Calculation Method |
|---|---|---|---|
| Scope 1 | Direct GHG emissions | 198 |
|
| Scope 2 | Indirect GHG emissions based on market standards | 733 |
|
| Indirect GHG emissions based on location standards | 847 |
|
|
| Scope 3 | Supply chain-related GHG emissions | 7,173 | |
| Category 1 | Purchased goods and services | 3,201 |
|
| Category 2 | Capital goods | 733 |
|
| Category 3 | Fuel- and energy-related activities not included in Scope 1 or Scope 2 | 171 |
|
| Category 4 | Upstream transportation and distribution | 391 |
|
| Category 5 | Waste generated in operations | 24 |
|
| Category 6 | Business travel | 50 |
|
| Category 7 | Employee commuting | 138 |
|
| Category 8 | Upstream leased assets | 0 |
|
| Category 9 | Downstream transport and distribution | 52 |
|
| Category 10 | Processing of sold products | 0 |
|
| Category 11 | Use of sold products | 2,196 |
|
| Category 12 | End-of-life treatment of sold products | 175 |
|
| Category 13 | Downstream leased assets | 42 |
|
| Category 14 | Franchises | 0 | Not applicable |
| Category 15 | Investments | 0 | Not applicable |
2024 Material Balance
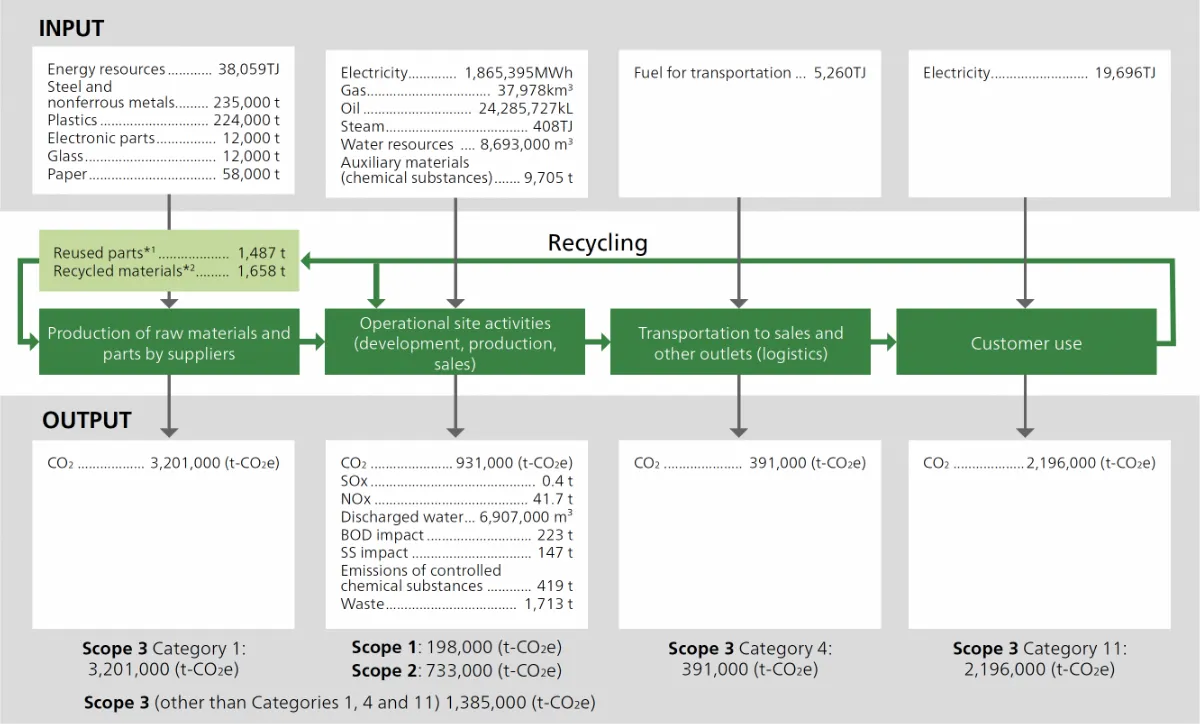
- *1 Reused products and parts
- *2 Plastic from used products for use as raw materials in new products
Canon compiles data for greenhouse gas (GHG; energy-derived greenhouse gas CO2, and non-energy derived greenhouse gases PFCs, HFCs, SF6, N2O, methane, and NF3). For CO2 emission factors for electricity, figures provided by individual electric supply companies are used, but publicly disclosed region-specific figures are used when figures are not provided by electric supply companies. For figures on customer use, electricity consumption of products shipped in a given year is calculated based on the average lifetime and printing volume, and converted to the CO2 equivalent using CO2 emission factors for electricity, which are calculated in the same way as the above methods. Past data may be revised due to improvements in the precision of data collection.
Environmental Performance Data
Third-party Assurance of GHG Emissions (Converted to CO2)
Third-party assurance has been obtained for CO2 emissions data appearing in "2024 Material Balance" and "Life Cycle GHG Emissions (CO2 Equivalent)" in 2024 and for each figure in "Scope 3 GHG Emissions in 2024."