Inventories, Cash on Hand, and Interest Bearing Debt
*2026 P = 2026 Projection
Last Updated: July 27, 2026
Inventories (Consolidated)
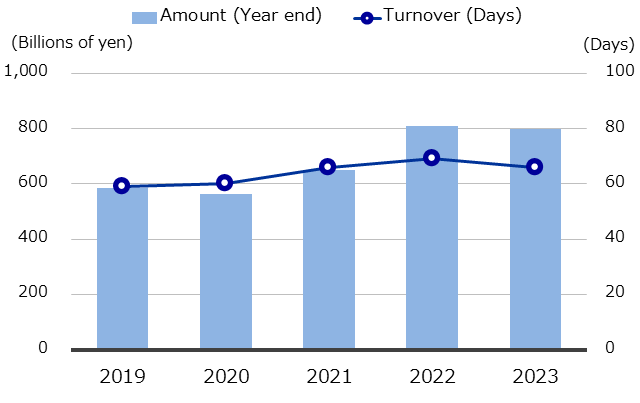
(Billions of yen)
| 2021 | 2022 | 2023 | 2024 | 2025 | |
|---|---|---|---|---|---|
| Amount (Year end) | 650.6 | 808.3 | 796.9 | 841.8 | 840.4 |
| Turnover (Days) | 66 | 69 | 66 | 65 | 63 |
Cash on Hand (Consolidated)
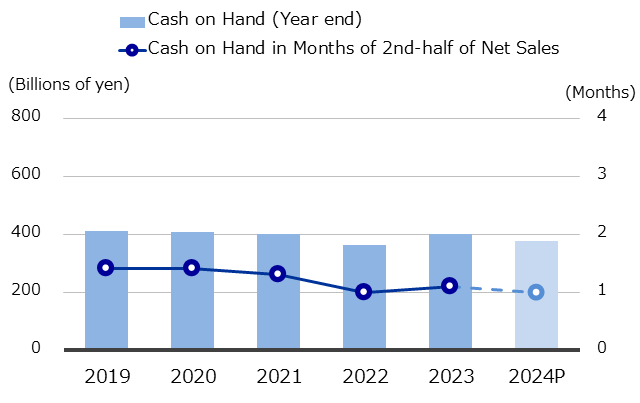
(Billions of yen)
| 2021 | 2022 | 2023 | 2024 | 2025 | 2026P | |
|---|---|---|---|---|---|---|
| Cash on Hand (Year end) | 401.4 | 362.1 | 401.3 | 501.6 | 586.0 | 425.0 |
| Cash on Hand in Months of Net Sales | 1.3 | 1.0 | 1.1 | 1.3 | 1.4 | 1.0 |
- *Cash on Hand in Months of Net Sales for 2026 is calculated using net sales for full year.
Interest Bearing Debt (Consolidated)
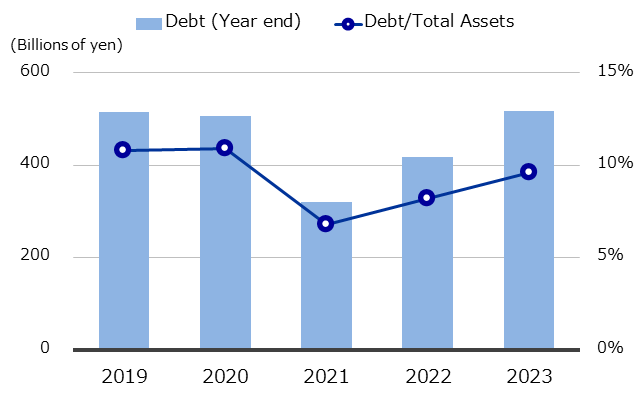
(Billions of yen)
| 2021 | 2022 | 2023 | 2024 | 2025 | |
|---|---|---|---|---|---|
| Debt (Year end) | 321.0 | 417.4 | 517.3 | 663.5 | 946.2 |
| Debt/Total Assets | 6.8% | 8.2% | 9.6% | 11.5% | 15.4% |