Sales by Business Unit
- Fiscal Year
- Quarterly
*2026 P = 2026 Projection
Last Updated: July 27, 2026
Sales by Business Unit (Consolidated)
(Billions of yen)
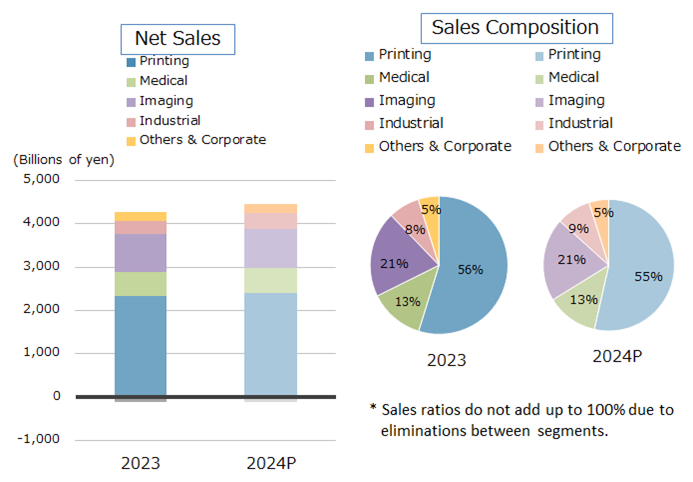
| Net Sales | Sales Composition | |||
|---|---|---|---|---|
| 2025 | 2026P | 2025 | 2026P | |
| Printing | 2,494.4 | 2,544.2 | 54% | 53% |
| Medical | 580.6 | 568.2 | 13% | 12% |
| Imaging | 1,054.9 | 1,201.5 | 23% | 25% |
| Industrial | 361.1 | 353.7 | 8% | 7% |
| Others & Corporate | 237.1 | 241.3 | 5% | 5% |
| Eliminations | -103.4 | -108.9 | -3% | -2% |
| Total | 4,624.7 | 4,800.0 | 100% | 100% |