


Sales by Geographic Area
- Fiscal Year
- Quarterly
*2026 P = 2026 Projection
Last Updated: July 27, 2026
Sales by Geographic Area (Consolidated)
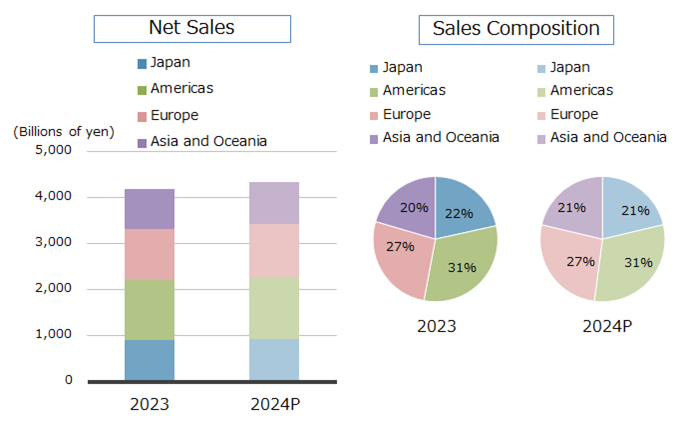
(Billions of yen)
| Net Sales | Sales Composition | |||
|---|---|---|---|---|
| 2025 | 2026P | 2025 | 2026P | |
| Japan | 961.5 | 974.9 | 21% | 20% |
| Americas | 1,489.6 | 1,539.6 | 32% | 32% |
| Europe | 1,225.5 | 1,290.0 | 26% | 27% |
| Asia and Oceania | 948.1 | 995.5 | 21% | 21% |
| Total | 4,624.7 | 4,800.0 | 100% | 100% |